Creating HTML reports
In this guide we're going to cover some of the possibilities that are available to you with our HTML report generators.
Note that the HTML Exporter is disabled by default. This is because, by design, the HTML exporter can also run scripts on your Dradis instance. To enable the HTML exporter, simply browse to the Integration and Tool Manager and click the Enable button under the HTML Exporter.
The possibilities here are endless and only limited by your HTML and CSS skills; we're just barely scratching the surface.
The result
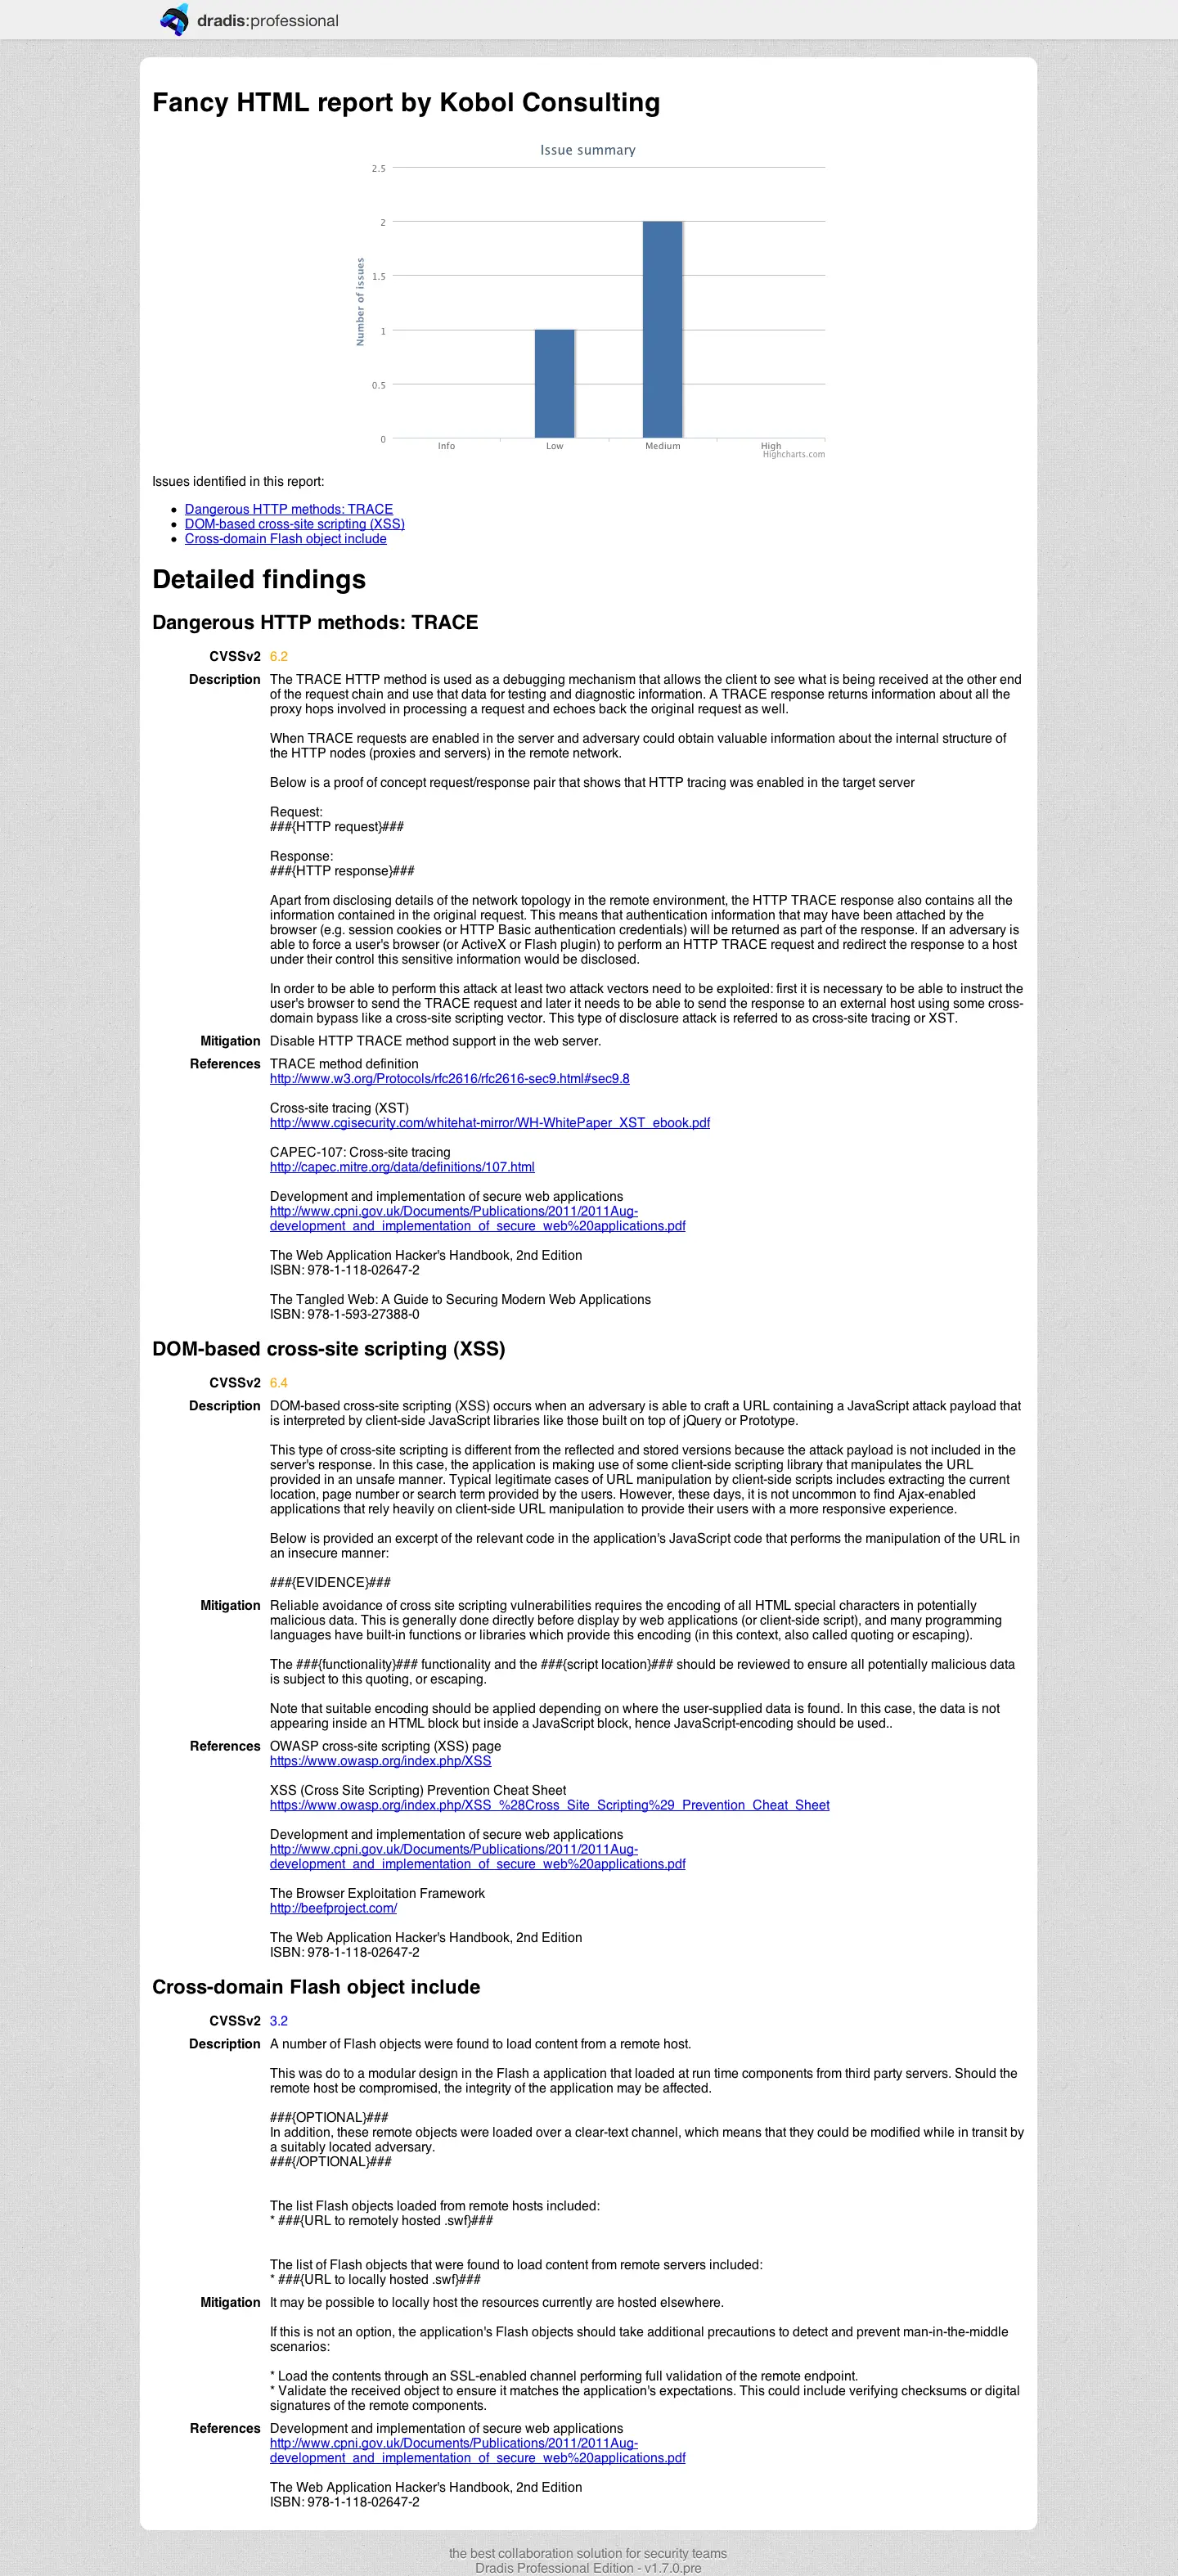
First things first, what are we trying to achieve? A nice looking HTML report like this:
An ERB primer
The template engine we'll use for our HTML report is called ERB.
The rules are straightforward:
<% Ruby code -- inline without output %>
<%= Ruby expression -- evaluated and output added to page %>Adding Issues
First the list of issues, these are available in the issues array:
<% for issue in issues do %>
<li><a href="#issue-a_<%= issue.id %>"><%= h issue.fields['Title'] %></a></li>
<% end %>
A simple for loop: we're outputting the Issue's Title and also preparing the href anchors that we'll use to link to the full note in the Detailed Findings.
Next we're going output the Title, CVSSv2, Description, Mitigation and References fields for each note:
<h1>Detailed findings</h1>
<% for issue in issues do %>
<div id="issue_<%= issue.id %>" class="note-content">
<h2><%= h issue.fields['Title'] %></h2>
<% ['CVSSv2', 'Description',
'Mitigation', 'References' ].each do |field_name| %>
<div class="field">
<div class="field-name <%= field_name.downcase %>">
<%= field_name %>
</div>
<div class="field-content <%= field_name.downcase %>">
<%= markup(issue.fields[field_name]) %>
</div>
</div>
<% end %>
</div>
<% end %>
First, we enclose each Issue in a <div> with note-content CSS class and an id of issue_<%= issue.id %>. This id is the one we used as href up in the list of issues.
We then output the Issue's title within <h2> tags and then we add each of the relevant fields.
Note how we add a CSS class corresponding to each field_name.downcase. This is so we can later refer to the fields to do some post-processing (e.g. CVSSv2 colors). To give you an idea of the markup generated by this code, it would look like this:
<div id="note_6903" class="note-content">
<h2>Dangerous HTTP methods: TRACE</h2>
<div class="field">
<div class="field-name cvssv2">CVSSv2</div>
<div class="field-content cvssv2">6.2</div>
</div>
<!-- ... -->
We need a bit of CSS to make this look nicer:
.field {
margin: 10px 0;
}
.field .field-name {
float: left;
font-weight: bold;
text-align: right;
width: 12.5%;
}
.field .field-content {
padding-left: 13.5%;
}
If you want to filter your Issues by Rating (or another fiter):
<% for issue in issues;
issue_rating = issue.fields['Rating'];
case issue_status
when "Critical"
%><h2><%= h issue.fields['Title'] %></h2><%
end
end %>
Add Evidence
You can add Evidence to your Issues by looping through the instances of evidence_by_node as shown below:
<% for issue in issues do %>
<h2><%= h issue.fields['Title'] %></h2>
<% issue.evidence_by_node.each do |node, instances| %>
<p><strong>Evidence for <%= node.label %></strong></p>
<% instances.each_with_index do |evidence, i| %>
<%= markup(evidence.fields['Description']) %>
<% end %>
<% end %>
<% end %>
Add Content Blocks
To add Content Blocks to your project, you'll need to filter the Content Blocks to make sure you're pulling the correct block into the correct location:
<% content_blocks = ContentBlock.where(project_id: project.id) %>
<% content_blocks.each do |block| %>
<% if block.fields['Type'].to_s == "ExecSummary" %>
<%= markup(block.fields['Description']) %>
<% end %>
<% end %>>
Add Document Properties
To pull document properties into your reports, first define a prop_list variable to call later. Then, you can pull the correct document property anywhere else in your HTML report with syntax like @prop_list["name"]:
<%# define variables to be called on later %>
<% @prop_list = content_service.all_properties %>
<h4><%= @prop_list["dradis.client"] %></h4>
Add Notes
To pull in Note data (see Content Blocks above if you want to pull in Content Blocks instead), you can simply iterate over notes, then filter by Type to pull in the correct Note:
<% for note in notes;
note_type = note.fields['Type'];
case note_type
when "ExecSummary"
%><h2><%= markup(note.fields['Title']) %></h2><%
%><%= markup(note.fields['Description']) %><%
end
end %>
markup method to output the fields in the correct format. If that's not possible, it is recommended that you sanitize the text for HTML tags! Failure to do so can lead to cross-site scripting issues as the HTML tags in the item's content will be executed as is.
Export Issues/Evidence by Node
This example gets a bit more complex but shows a real-world use case. In this example, we're exporting just Host Nodes (e.g. not exporting any Nodes that are used as project folders without any Evidence or Node properties associated with them). Then, we're printing out a Heading with the node label followed by each Issue that affects that Node and a listing of the Evidence for each Issue.
You can see this specific example in action as part of our OSCP Compliance Pack.
<% for node in Node.user_nodes %>
<% if node.type_id == Node::Types::HOST %>
<div id="node_<%= node.id %>" class="note-content">
<h3>System: <%= node.label %></h3>
<% for evidence in node.evidence do %>
<% issue = evidence.issue %>
<% rating = issue.fields['Severity'].to_s.downcase %>
<div id="note_<%= issue.id %>" class="note-content">
<h4>Vulnerability Exploited: <%= h issue.fields['Title'] %></h4>
<p><strong>Vulnerability Explanation:</strong> <%= h issue.fields['Description'] %></p>
<p><strong>Vulnerability Fix:</strong> <%= h issue.fields['Fix'] %></p>
<p><strong>Severity: </strong><strong class="rating-<%= rating %>">Critical</strong></p>
<div class="content-textile" id="evidence_<%= node.id %>">
<p><strong>Proof of Concept Code for <%= node.label %>:</strong></p>
<%= markup(evidence.fields['Proof']) %>
<p><strong>Screenshot for <%= node.label %>:</strong></p>
<%= markup(evidence.fields['Screenshot']) %>
</div>
</div>
<% end %>
</div>
<% end %>
<% end %>
Export node properties and service tables
The example below prints all nodes, all their properties, and service tables (if present).
<h2>Service Tables</h2>
<% for node in nodes %>
<h3>Node: <%= node.label %></h3>
<% if node["properties"].any? %>
<% node["properties"].each do |key, value| %>
<% unless key == "services" %>
<h4><%= key %>: <%= value %></h4>
<% end %>
<% end %>
<% if node["properties"]["services"].any? %>
<table class="services-table">
<thead>
<tr>
<% node["properties"]["services"].first.keys.each do |key| %>
<th><%= key %></th>
<% end %>
</tr>
</thead>
<tbody>
<% node["properties"]["services"].each do |service| %>
<tr>
<% service.each do |key, value| %>
<td><%= value %></td>
<% end %>
</tr>
<% end %>
</tbody>
</table>
<% end %>
<% end %>
<% end %>Here is a simple CSS styling for the services tables to get you started:
.services-table {
width: 100%;
border-collapse: collapse;
margin-bottom: 20px;
}
.services-table th, .services-table td {
border: 1px solid #dddddd;
text-align: left;
padding: 8px;
}
.services-table th {
background-color: #f2f2f2;
}Add Methodologies
Add Methodology data to your project by iterating through Boards, Lists, and Cards. You can filter as needed (e.g. filter by the list named "Done") to restrict your results further.
<% for board in Board.where(project_id: project.id) do %>
<h2><%= board.name %></h2>
<% for list in List.where(board_id: board.id) do %>
<% if list.name == "Done" %>
<ul>
<% for card in Card.where(list_id: list.id) do %>
<li><p><%= card.name %></p></li>
<% end %>
</ul>
<% end %>
<% end %>
<% end %>
Bells and whistles part 1: the chart
We're going to use the excellent Highcharts library, in particular the column chart (make sure you check their licensing page as it is only free for non-commercial use).
To keep things simple we start adding the reference to the library and a dummy chart inside our <head></head> block directly from their docs:
<script src="http://code.jquery.com/jquery-1.9.1.min.js"></script>
<script src="http://code.highcharts.com/highcharts.js"></script>
<script type="text/javascript">
$(function () {
var chart;
chart = new Highcharts.Chart({
chart: {
renderTo: 'bar-chart',
type: 'column'
},
title: {
text: 'Issue summary'
},
xAxis: {
categories: [
'Info',
'Low',
'Medium',
'High'
]
},
yAxis: {
min: 0,
title: {
text: 'Number of issues'
}
},
legend: {
enabled: false
},
tooltip: {
formatter: function() {
return ''+
this.x +': '+ this.y +' issues';
}
},
plotOptions: {
column: {
pointPadding: 0.2,
borderWidth: 0
}
},
series: [{
// dummy data
data: [3, 5, 7, 3]
}]
});
});
</script>
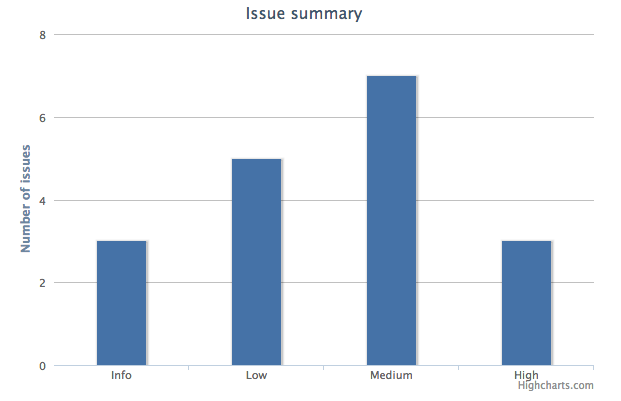
Then we need a holder for our chart in the <body></body>, we'll assign it a bar-chart id which matches the renderTo property above:
<div id="bar-chart" style="max-width: 600px; min-width: 400px; height: 400px; margin: 0 auto"></div>And the final result:
Replacing real data in the chart, will require a bit of work.
We receive our issues in the notes array. Whilst all of them do have a CVSSv2 score, these are unsorted. Se need to go through the array and sort it based on the score.
We've defined the ranges as follows:
| CVSSv2 score | Category |
|---|---|
| 0..0.9 | Info |
| 1.0..3.9 | Low |
| 4.0..6.9 | Medium |
| > 7.0 | High |
We are going to create the sorted Ruby hash that we'll use to group the issues into these categories. We have to enclose this Ruby code within <% ... %> tags (no =) in the page:
<script type="text/javascript">
// this hash will map issue id's to CSS classes associated with their
// CVSS score
var noteClassName = {};
<% sorted = { :info => [], :low => [], :medium => [], :high => []} %>
<% for issue in issues;
cvss = issue.fields['CVSSv2'].to_f;
case cvss
when 0..0.9
sorted[:info] << issue
when 1.0..3.9
sorted[:low] << issue
when 4.0..6.9
sorted[:medium] << issue
else
sored[:high] << issue
end
end %>
// ...
</script>
So once the for loop has gone through all the issues in the array, we will have a sorted hash with all the issues grouped by category, for instance, something like:
{ :info=>[],
:low=>[#<Issue id: 6905 [...]>],
:medium=>[#<Issue id: 6903 [...]>, #<Issue id: 6904 [...]>],
:high=>[]
}
Which is exactly what we need for the data series in our chart. We can now replace the dummy values with the real data:
//...
series: [{
data: [
<%= sorted[:info].count %>,
<%= sorted[:low].count %>,
<%= sorted[:medium].count %>,
<%= sorted[:high].count %>
]
}]
//...
Where we are just counting the number of issues in each category.
Bells and whistles part 2: CVSSv2 colors
First we're going to add color to the CVSSv2 scores:
- First we locate each CVSSv2 field. We'll use
.cvssv2class name assigned to the field. - For each CVSSv2 field, we locate the corresponding issue container (with
note-contentclass) and extract the issueid. - Finally, we add a new CSS class given by the mapping in the
noteClassNamehash (see below).
<script type="text/javascript">
$(function(){
// color-code CVSSv2 scores
var note_id;
var $cvssv2_content;
$('.field-content.cvssv2').each(function(){
// each note-content <div> has an id of note_<issue.id>
note_id = $(this).parents('.note-content').attr('id').split('_')[1];
// we add a CSS class to the CVSSv2 content depending on the
// issue's score
$(this).addClass( noteClassName[ note_id ] );
});
})
</script>
We are going to define a bunch of CSS classes mapping to the Info, Low, Medium and High ranges we used in our chart:
.cvss-info { color: green; }
.cvss-low { color: blue; }
.cvss-medium { color: orange; }
.cvss-high { color: red; }
We're going to re-use the case statement we used for the chart for saving the mapping between each issue's CVSSv2 score and the corresponding CSS class.
- We define the global
noteClassNamehash that will contain noteids as keys and the CSS class as value. - Inside the case/when statement:
- We close the ERB evaluation (with
%>) - Assign the
noteClassNamevalue - Re-open the ERB evaluation (with
<%)
- We close the ERB evaluation (with
<script type="text/javascript">
// this hash will map note id's to CSS classes associated with their
// CVSS score
var noteClassName = {};
<%# Create a Ruby hash mapping each note to a risk level %>
<% sorted = { :info => [], :low => [], :medium => [], :high => []} %>
<% for issue in issues;
cvss = issue.fields['CVSSv2'].to_f;
case cvss
when 0..0.9
sorted[:info] << issue
%>noteClassName[<%= issue.id %>] = 'cvss-info'; <%
when 1.0..3.9
sorted[:low] << issue
%>noteClassName[<%= issue.id %>] = 'cvss-low'; <%
when 4.0..6.9
sorted[:medium] << issue
%>noteClassName[<%= issue.id %>] = 'cvss-medium'; <%
else
sored[:high] << issue
%>noteClassName[<%= issue.id %>] = 'cvss-high'; <%
end
end %>
//...
</script>
Remember that anything between <% ... %> tags does not generate any output whilst anything enclosed in <%= ... %> does. So, the snippet above results in the following HTML:
<script type="text/javascript">
// this hash will map issue id's to CSS classes associated with their
// CVSS score
var noteClassName = {};
noteClassName[6903] = 'cvss-medium'; noteClassName[6904] = 'cvss-medium'; noteClassName[6905] = 'cvss-low';
</script>
The white lines correspond to the ERB tags that evaluated Ruby code but did not generate any output.
This is a bit tricky, we have used a single @case@ statement to:
- Generate the
sortedhash in Ruby. - Generate the
noteClassNamehash in JavaScript.
Now if you go back to our color-coding JavaScript snippet, you can see that we use the @noteClassName@ to figure out the CSS class we need to use in each case:
// we add a CSS class to the CVSSv2 content depending on the
// issue's score
$(this).addClass( noteClassName[ issue_id ] );
Bells and whistles part 3: external links
This is the easiest one to add, just a bit of text post-processing:
- Locate the
Referencescontent. - Match against a regular expression for URLs.
- Replace plaint-text URL with an HTML link.
<script type="text/javascript">
$(function(){
// auto-link URLs
var link_regexp = /(\b(https?|ftp):\/\/[-A-Z0-9+&@#\/%?=~_|!:,.;]*[-A-Z0-9+&@#\/%=~_|])/ig;
$('.field-content.references').each(function(){
$(this).html( $(this).html().replace(link_regexp,"<a href='$1'>$1</a>") );
});
})
</script>
That's it for now. We just need to copy the template across and use it. Follow the instructions on the Report Templates page of the Administration guide.
Generating the report
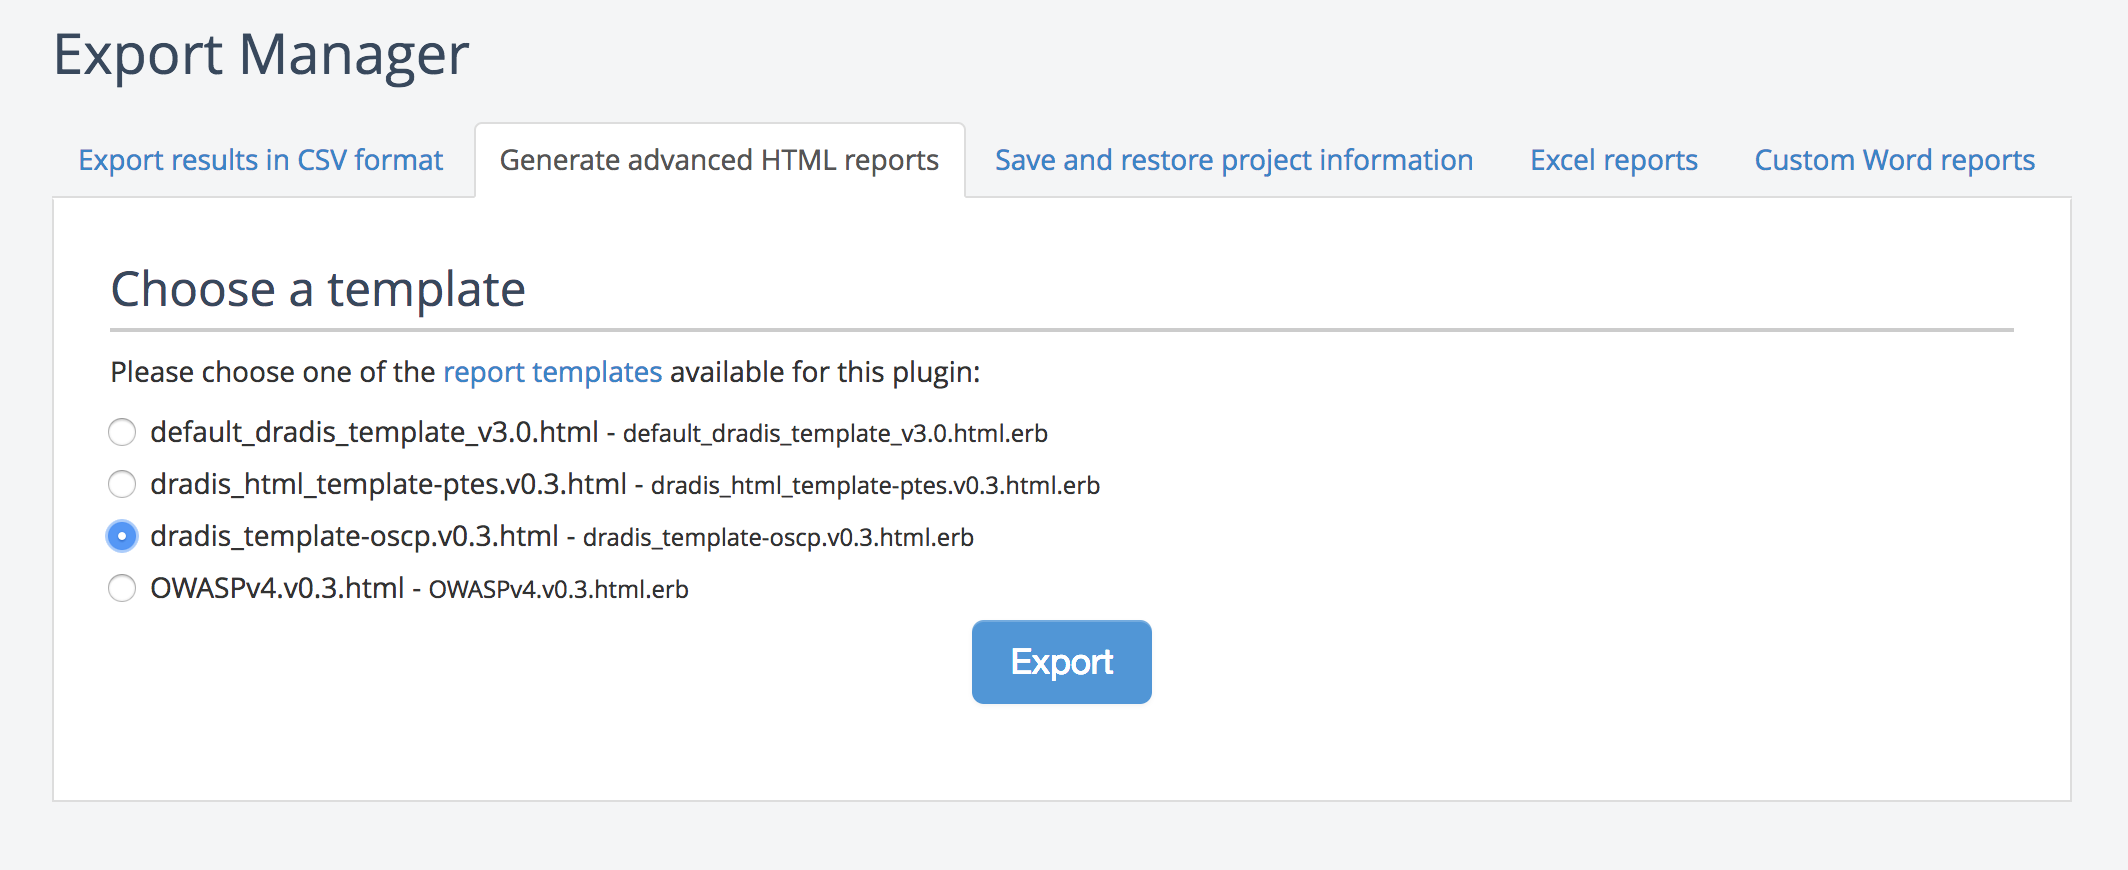
Once the template is uploaded into Dradis, you can generate a report through the Export menu:
Export your report in the webapp
- Sign into Dradis as an Administrator
- Open the project you want to export
- Navigate to Export results in the header, then open the Generate advanced HTML reports tab
- Select the correct template from the list that appears, then click Export
Export your report through the command line
If you run into any problems exporting your project through the Export Manager or your export takes too long, try exporting through the command line instead.
Before you begin, locate the ID of the project you want to export and the location of your HTML report template.
You can get your project ID from the browser location bar once you open the project in the main Dradis interface. For example, if the browser shows https://192.168.56.102/pro/projects/50, your project ID is 50.
The location of the template can be anywhere in the appliance. However, if you used the web interface to upload your template there is a good chance it would have ended under this location:
/opt/dradispro/dradispro/current/templates/reports/html_export/However, to make the examples more readable we'll use /tmp/test.html.erb as the sample location of our template in the following steps.
To export to HTML from the command line:
-
SSH into the box as dradispro and navigate to the
currentfolder:cd /opt/dradispro/dradispro/current Run the
dradis:pro:plugins:html:exportcommand.For our example, with a project ID of 50, the command we need to run is this:
PROJECT_ID=50 RAILS_ENV=production bundle exec thor \ dradis:plugins:html:export \ --output=/tmp/ \ --template=/tmp/test.html.erbIf you are using Dradis on Docker, run instead:
docker exec -it -e PROJECT_ID=50 app bundle exec thor dradis:plugins:html:export --output=/tmp/ --template=/path/to/template.html.erb-
Download your report from the output location (
/tmp/) displayed after the export finishes.
Next help article: Export your project to CSV →