Dradis v5.2 touches a wide array of functionalities. List fields bring ordered value sets to Issue prioritization and sorting, the ServiceNow integration gets broader coverage across modules, and the CVSS Calculator gets a redesign built around the workflow of actually scoring a finding.
Here’s what’s new!
List Fields and Multi-Column Issue Sorting
Not every Issue field fits neatly into score-based sorting alone. Severity ratings, new vs existing vulnerabilities, remediation priority, OWASP category, and more are values worth sorting issues by that a CVSS score alone doesn’t capture.
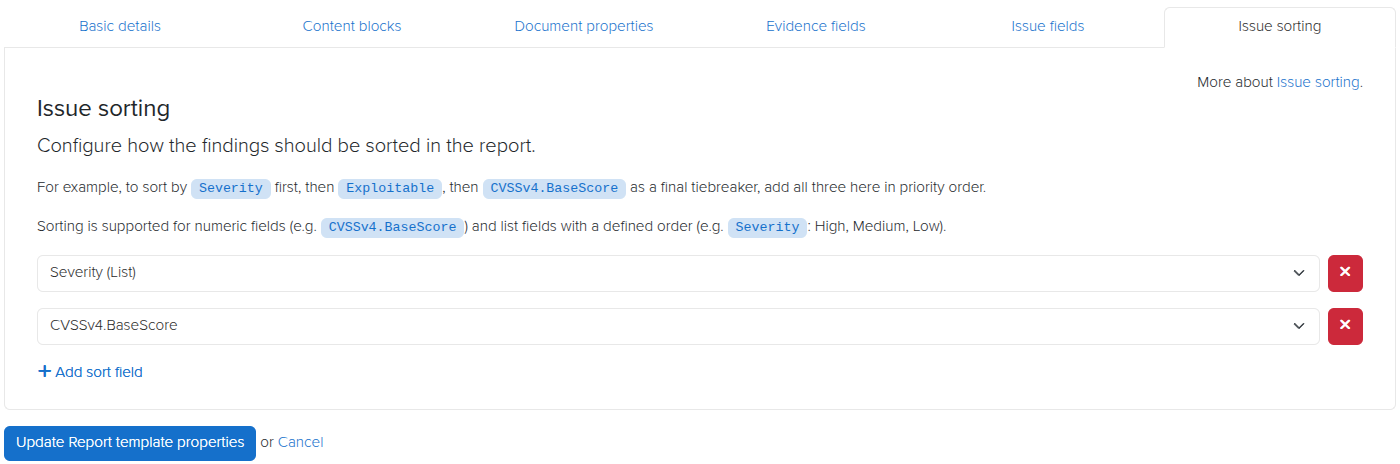
The new List field type lets you define an ordered set of values for an Issue field, so “Critical > High > Medium > Low” (or whatever set makes sense for your methodology) is captured as a label to sort by. Once defined, List fields can work alongside numeric fields or even other List fields as sort criteria. You can now sort Issues by multiple fields at once, in a defined order, and get precise control over how findings are prioritized and ordered in your reports.
This is particularly useful when a single sort key isn’t enough: sort by OWASP category first, then by a custom List field for remediation urgency, then by CVSS score, and your report comes out exactly as your reviewers expect it.
You can even define colours for lists, so you can specify font colours or table cell background colours to match your list preferences.
ServiceNow Vulnerable Items
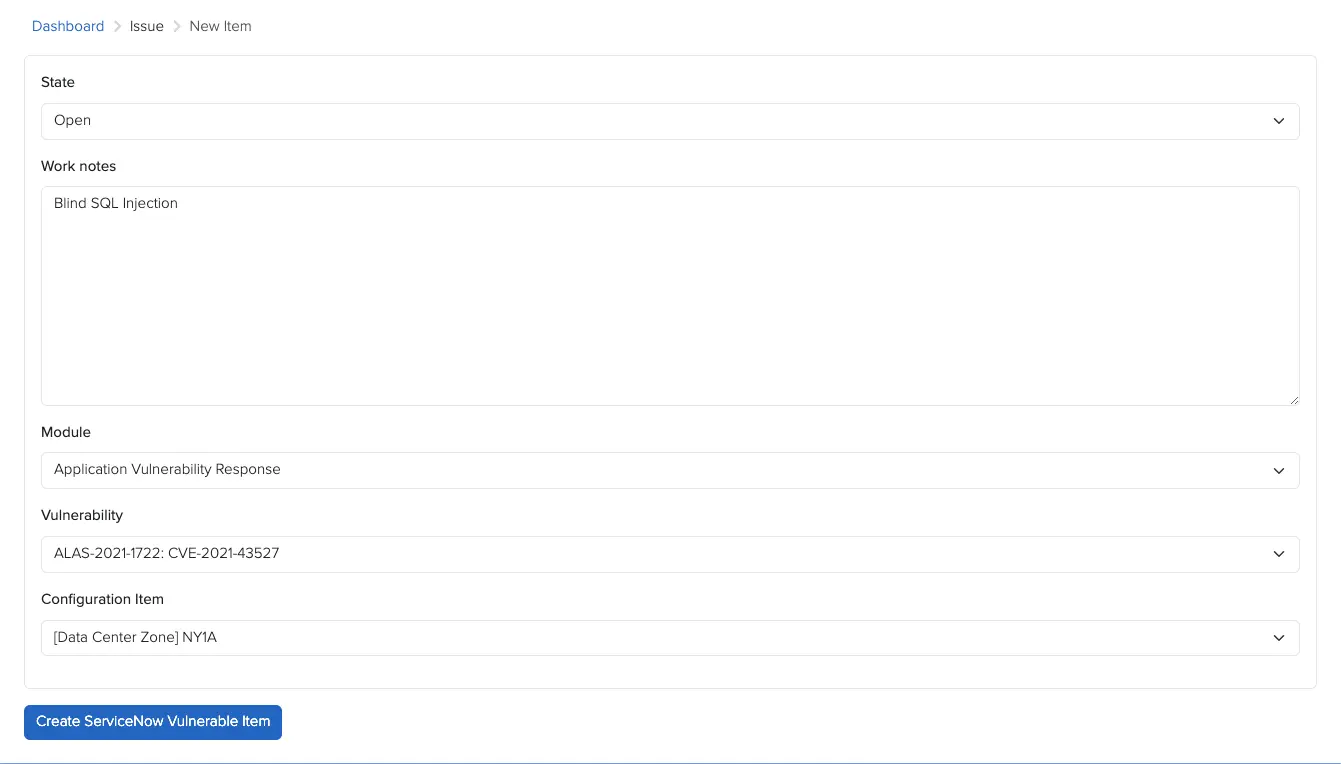
The ServiceNow integration has historically created Vulnerable Items in a single module. With v5.2, that coverage expands: Vulnerable Items are now created across the Application, Container, and Vulnerability Response modules.
If your ServiceNow environment spans more than one of these modules, you’ll now get broader coverage without any extra configuration on your end — the integration handles the routing automatically based on where the vulnerability applies.
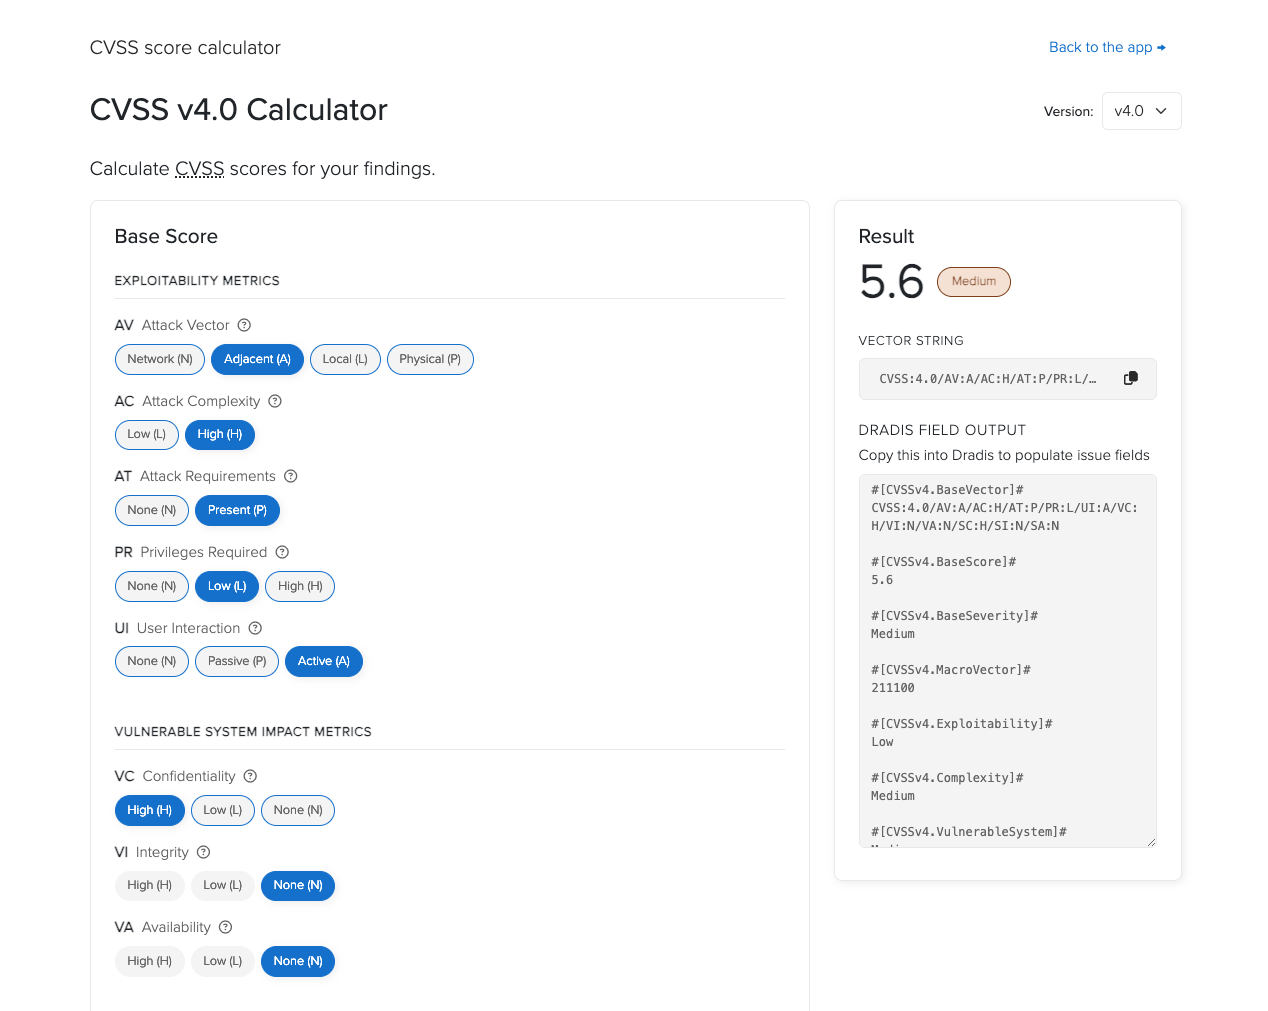
CVSS Calculator Redesign
The CVSS Calculator has a new two-column layout with a sticky results panel, so your score stays visible as you work through the metrics instead of scrolling back and forth to check it.
Severity badges give instant visual context as you adjust metrics, and a one-click button copies the vector string straight to your clipboard — no more selecting and copying text by hand when you need to paste the vector elsewhere.
Release Notes
UI: add dark mode support to the login and setup wizard pages
Issue Library: default imported issue state to draft
Kits: new default Welcome kit option
Report templates: allow sorting issues by list fields in addition to numeric fields
v5.1 is a focused release. Echo gets its first Agent, more LLM providers, and inline grammar checking. Business Intelligence gains a date field type. Also included are a raft of bug fixes.
Here’s what’s new!
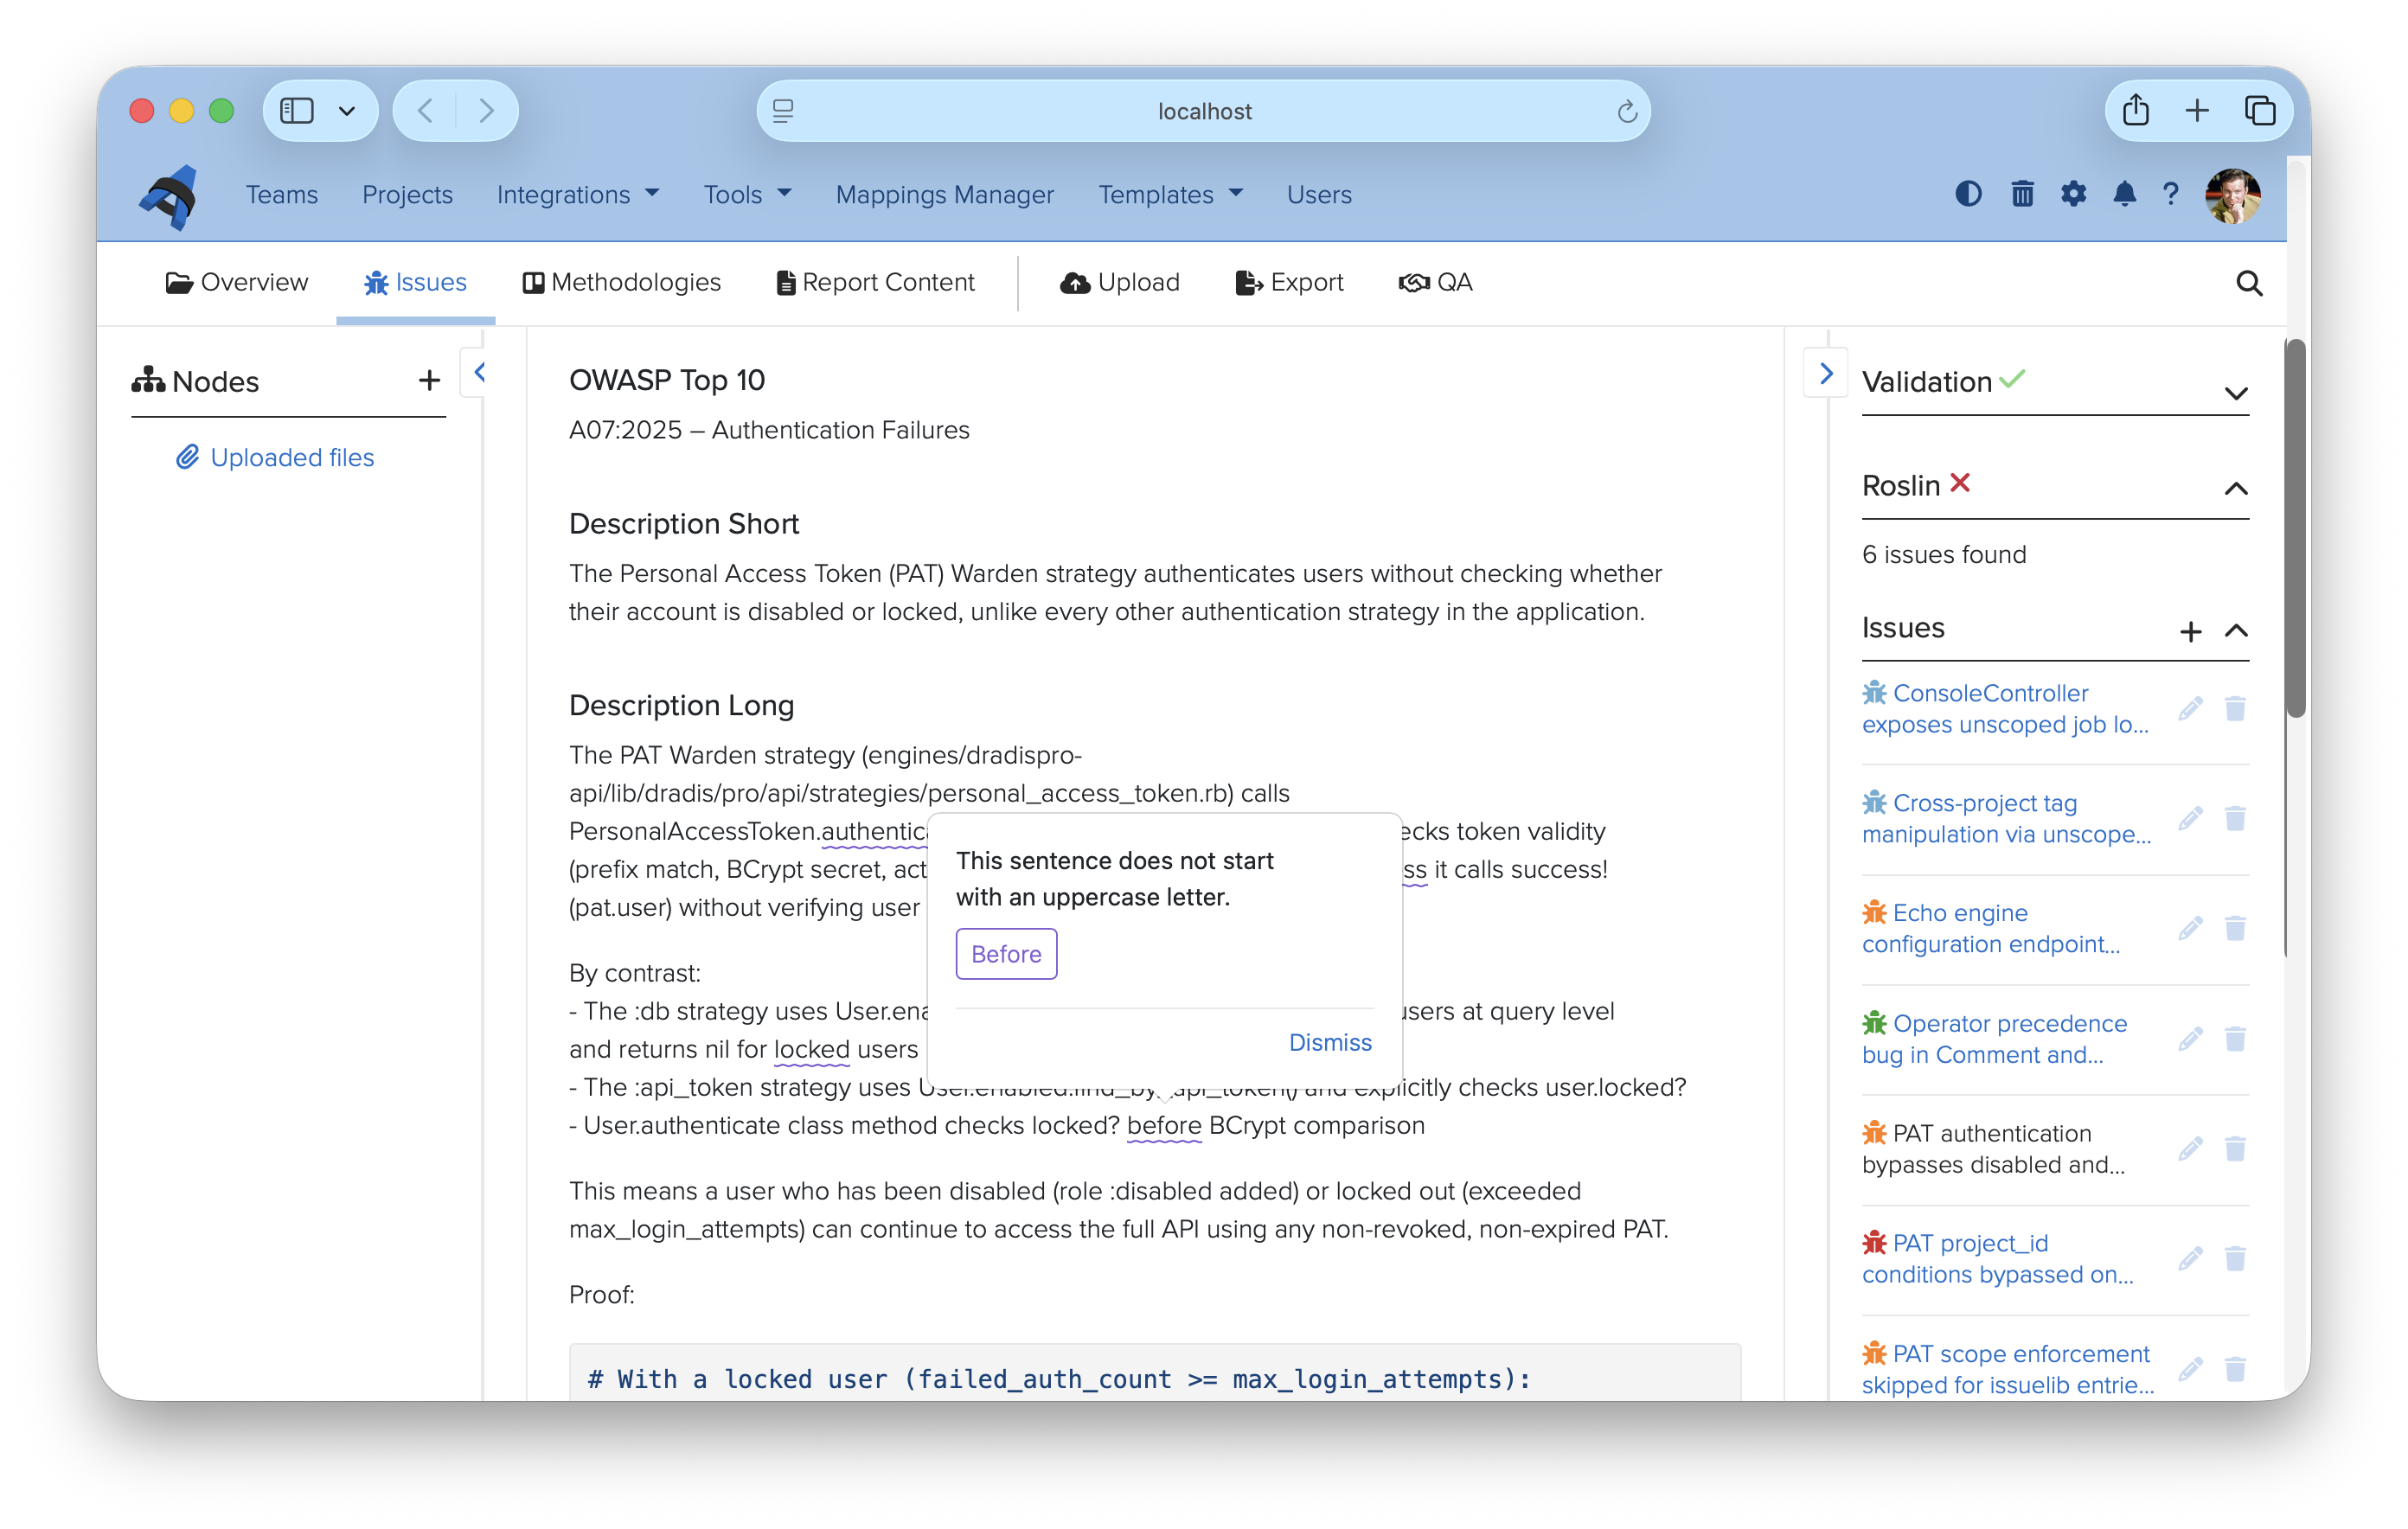
Writing quality checks with Roslin
Report writing is where the work lives. The content your clients receive reflects the care your team put in, and a single typo in a critical finding can undermine that impression before they’ve finished reading it.
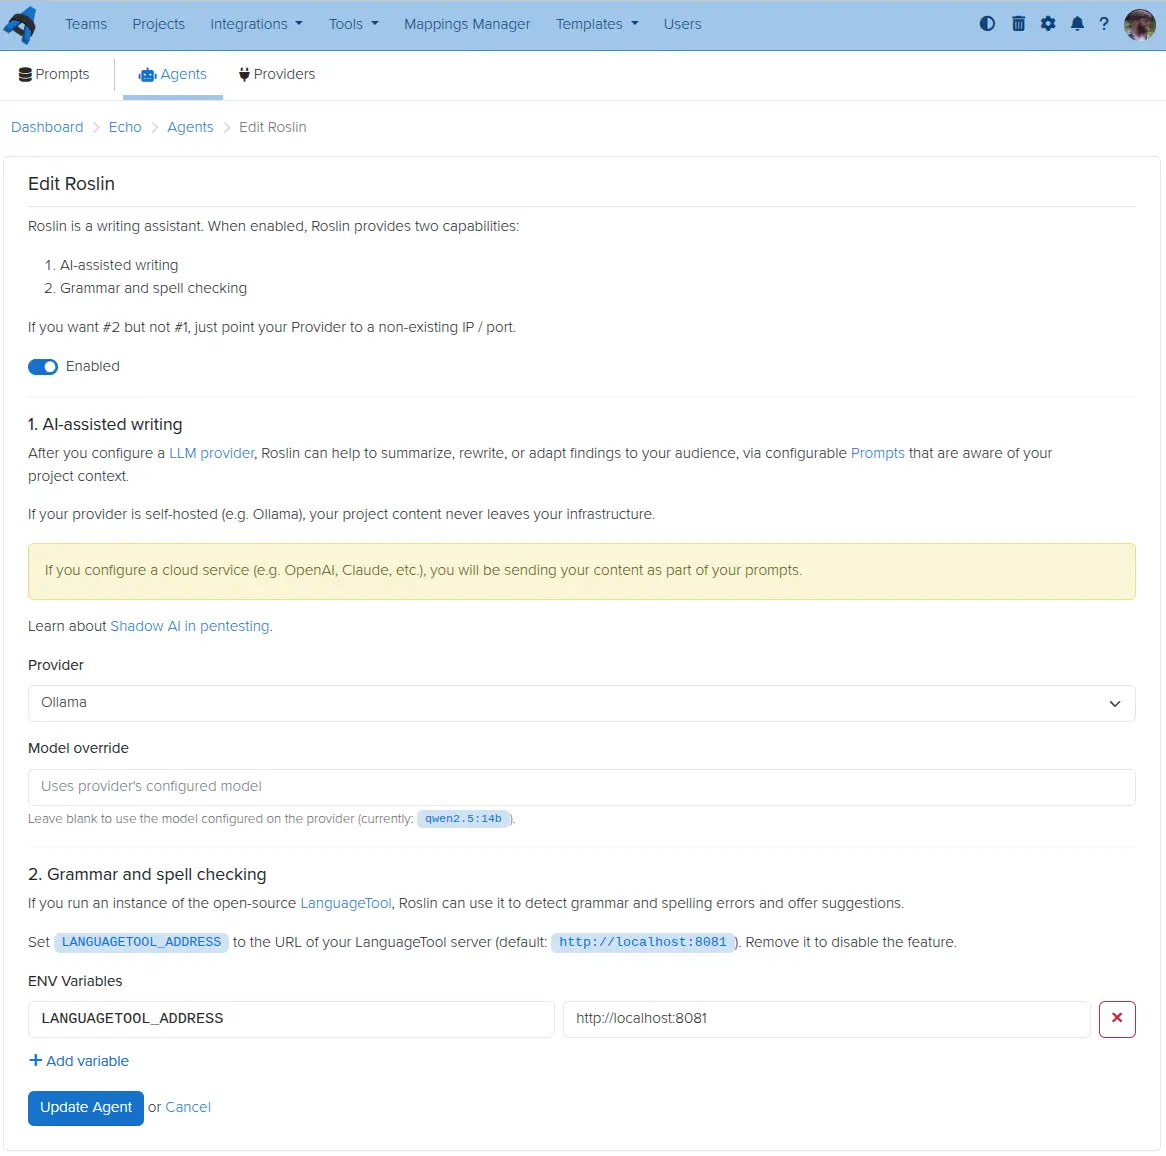
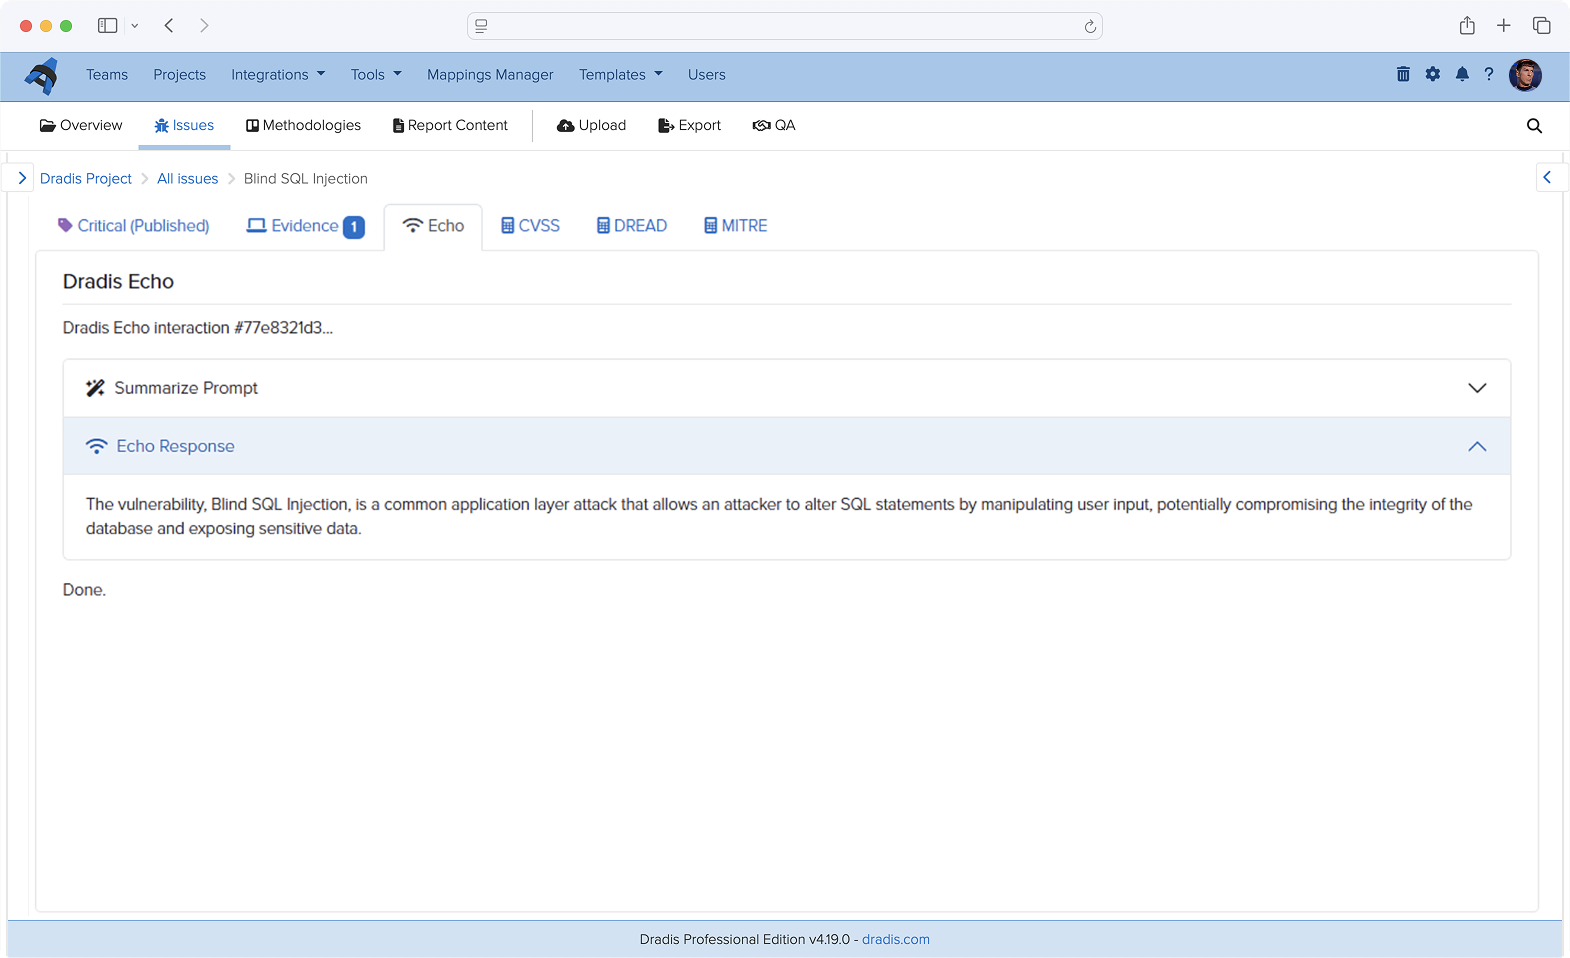
Roslin is our first Echo Agent — a configurable assistant that extends Echo beyond prompts and into the editing experience itself. Connect it to a LanguageTool instance (self-hosted or local) and it checks grammar, spelling, and style inline as you work. Issues are highlighted directly in the findings editor, with suggestions shown in context and one-click replacements. Dismissed suggestions are remembered per-browser, so they won’t surface again on your next visit.
The grammar and spell check side of Roslin runs entirely on LanguageTool, which means your finding content never has to leave your network to use it. If you also configure an LLM provider on the agent, Roslin picks that up for AI-assisted writing too — the two capabilities are independent and can be enabled in any combination.
To get started, visit Tools → Echo → Agents and click Edit next to Roslin. The Roslin setup guide walks through the LanguageTool configuration.
Echo for more providers
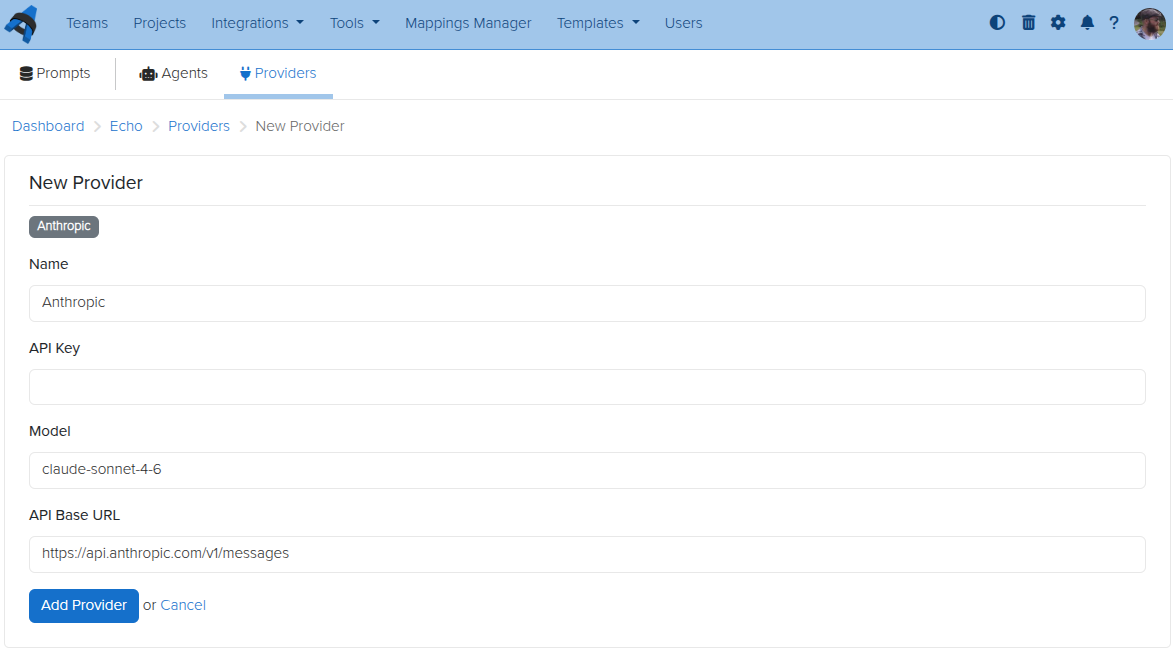
Echo launched with Ollama — a great option for teams that want local, private LLM processing. With v5.1, you can now also connect to OpenAI, Anthropic, and Google Gemini as provider options.
Each provider is configured separately under Tools → Echo → Providers, giving you a named connection with its own API key, endpoint, and default model. You can have multiple providers configured at once and choose between them per agent or per use case. If you prefer to keep everything on-premises, Ollama remains fully supported.
For cloud providers, be aware that your finding content will be sent to the external service as part of each prompt. If data residency matters for your engagements, Ollama is still the right choice.
Business Intelligence custom properties have supported text and numeric values since launch. v5.1 adds a dedicated date field type.
That means you can now store structured date values — engagement start dates, remediation deadlines, retest windows — as first-class BI properties rather than free-text workarounds. Date fields behave like other custom properties: they are available in your dashboards, filterable, and can be tracked across projects over time.
If you have existing date values stored as text fields, now is a good time to migrate them over to take advantage of proper date filtering.
Release Notes
DataTables:
Add sticky table toolbar that tracks below the navigation bar when scrolling
Mail:
Add support for SMTP configuration via environment variables for Docker deployments; smtp.yml remains supported for VM deployments during the deprecation transition
This is the story of how the Dradis 5.0 release we’d been working on for months got delayed by 48 hours, thanks to Claude. Dradis is a self-hosted pentest reporting and collaboration platform used by cybersecurity teams around the world.
On April 14, 2026, OpenAI announced GPT-5.4-Cyber, a variant of GPT-5 tuned for cybersecurity work. The same day, Dradis 5.0 was scheduled to ship. A week before GPT-5.4-Cyber, Anthropic had announced Mythos Preview, claiming Claude could now identify and exploit zero-day vulnerabilities in every major operating system and web browser.
Two weeks before that, Thomas Ptacek (tptacek) published “Vulnerability research is cooked”, profiling how Nicholas Carlini at Anthropic’s Frontier Red Team runs Claude across every file in a codebase and asks it to find bugs.
Three announcements, sixteen days. Reading them while our next major release sat green and ready to push, the answer was obvious. It would be irresponsible to ship 5.0 without running the same kind of audit on our own code. Forty-eight hours later, eight findings had been triaged and fixed, and 5.0 went out the door.
Key Takeaways
Between March 30 and April 14, 2026, three major AI security announcements changed what a reasonable engineering team should try on its own code before a release.
We held Dradis 5.0 for 48 hours to run an AI-assisted security audit on the codebase. Eight findings surfaced. Every finding was triaged, fixed, and merged before the release shipped.
The brute-force “Claude on every file” approach that Carlini uses is viable but expensive. Building an architectural primer once, then running per-file audits warm, produced sharper findings at a fraction of the cost.
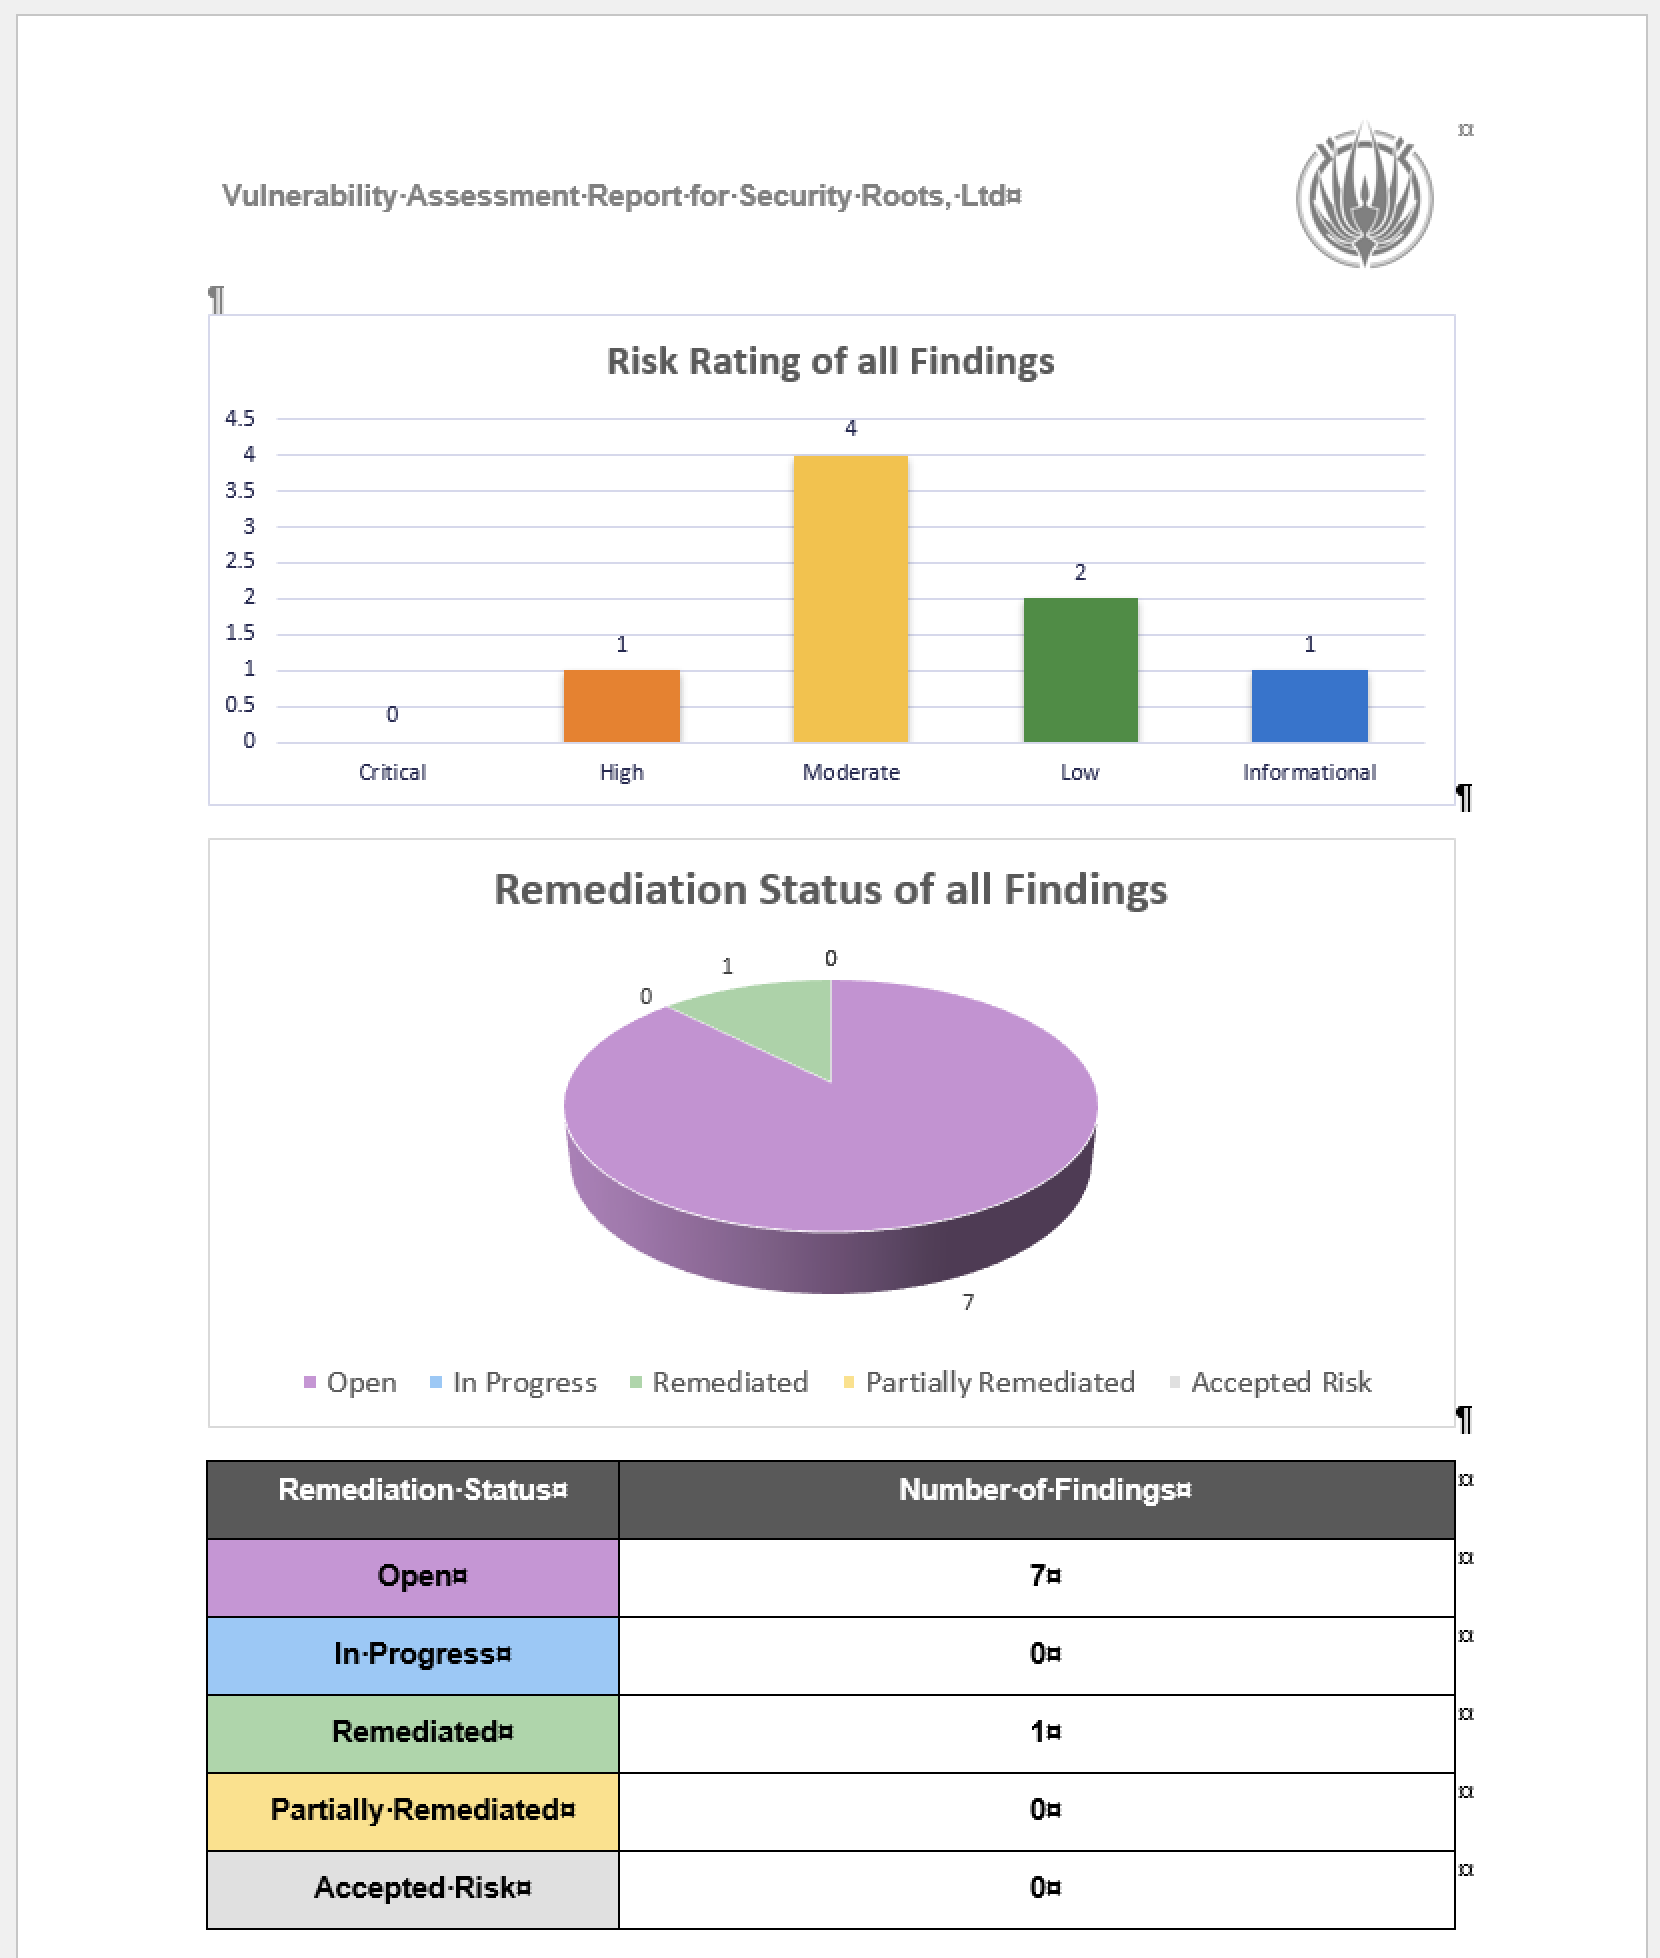
We tracked the audit using Dradis itself, organized against the OWASP Top 10 2025 methodology and templates shipped in 5.0. The reporting tool reported on its own vulnerabilities.
The 48-hour turnaround was possible because Dradis already runs an AI-assisted code review pipeline as part of the standard PR workflow. Without that infrastructure already in place, the audit would have taken longer or shipped rougher.
We can publish the audit this transparently because the Dradis code is self-hosted and open-source, and you can inspect and extend Dradis. You may be interested in the fixes in dradis/dradis-ce PRs.
This applies if
You ship a product that handles sensitive data and want to understand what an AI-assisted security audit looks like in practice, not in a vendor pitch.
You are evaluating Dradis (or any security platform) for a regulated environment and want to see how the team behind it operates when the stakes are real.
You run your own codebase and want to replicate the primer-first audit pattern described here. The practical steps section at the end is sized for that.
Skip this if
You are looking for a general introduction to AI in cybersecurity. This is a specific case study about a specific audit on a specific codebase in a specific 48-hour window.
You want a comparison of AI coding assistants. We used Claude because it was the tool that fit. The pattern works with other frontier models.
The three announcements that made this inevitable
On March 30, Ptacek’s piece introduced a lot of people to the Carlini method. It’s disarmingly simple. Download a code repository. Write a bash script. Inside the loop, run the same Claude Code prompt against every source file:
“Find me an exploitable vulnerability in this project. Start with ${FILE}.”
Ptacek compares it to “a kid in the back seat of a car on a long drive, asking ‘are we there yet?'” The stochasticity is a feature. Each invocation is a slightly different attempt at the same question, and the diffs across runs find things single-shot audits miss.
A week later, Anthropic announced Mythos Preview. The headline claim was that Claude can now identify and exploit zero-days in every major operating system and every major web browser when directed to do so. The Mythos post included the detail that non-experts have used the model to produce working exploits overnight. That one sat with us for a few days.
Then GPT-5.4-Cyber landed on April 14, the same day our 5.0 release branch was green and ready to push. OpenAI’s announcement framed it as a defensive model with lowered refusal boundaries for legitimate security work. Reverse engineering, vulnerability analysis, malware analysis. Access gated behind the Trusted Access for Cyber program.
Three announcements in sixteen days. We serve the security industry. Our customers use Dradis to hold their most sensitive client data. We ship a major release the same week two of the largest AI labs release models purpose-built for offensive security work. Reading those announcements while the release sat ready, the question answered itself. Not shipping without trying this on our own code first was the only defensible position.
The brute-force approach, and why we didn’t use it
The first instinct was the Carlini method exactly. Bash loop. Every file. Claude Code with the vuln-finding prompt. The Pro codebase narrowed to roughly 660 Ruby files in the audit surface. Routed controllers, models, jobs, libs touching user input. We did the math on Opus pricing against that file count and came out around $1,000 to $1,600 for a single pass. On Sonnet, $200 to $330. Wall-clock hours per pass, much of it re-discovering the same architecture in every cold invocation.
The cost was not the deal-breaker. The time was. We had 48 hours to run the audit and ship, not 48 hours of compute budget. And more importantly, the quality signal was wrong. Every file-scan spent most of its token budget re-learning what authentication looked like in our codebase, where current_project came from, how the CanCanCan ability model routed authorization. Each call arrived at the file cold, rediscovered the scaffolding, then had a few thousand tokens left to reason about the actual file.
So we changed the shape.
The Primer pivot
Instead of 660 cold starts, one warm one. A single Opus session read the routes, the controller hierarchy, the four Warden strategies, the CanCan ability model, the API base controllers, the Personal Access Token scope-enforcement logic, and the project-scoping concerns. That session produced THREAT_PRIMER.md, an architectural orientation document. Its opening paragraph sets the frame for everything after it:
You are auditing the Dradis Pro Rails app for exploitable vulnerabilities. This primer summarizes the auth, authorization, and request-flow scaffolding so you don’t have to rediscover it for every file. Read this first, then focus your investigation on the specific file you were given.
The primer runs about 2,000 tokens. Authentication chains. Authorization model. Sensitive sinks (file uploads, Liquid templates, mass assignment, jobs that deserialize user input). A section called “Patterns that look scary but are intentional“, so the audit wouldn’t waste time re-flagging design decisions like returning 404 instead of 403 on authorization failures as info-hiding.
This is what the primer bought us: subsequent per-file audits started warm. Every scan got the primer in context before it saw the file. Same coverage as Carlini’s approach, sharper findings because each pass arrived knowing the architecture, dramatically lower cost because the structural learning happened once instead of 660 times.
That pivot alone took the work from “not doable in 48 hours” to “doable in 48 hours, with time left for fixes.”
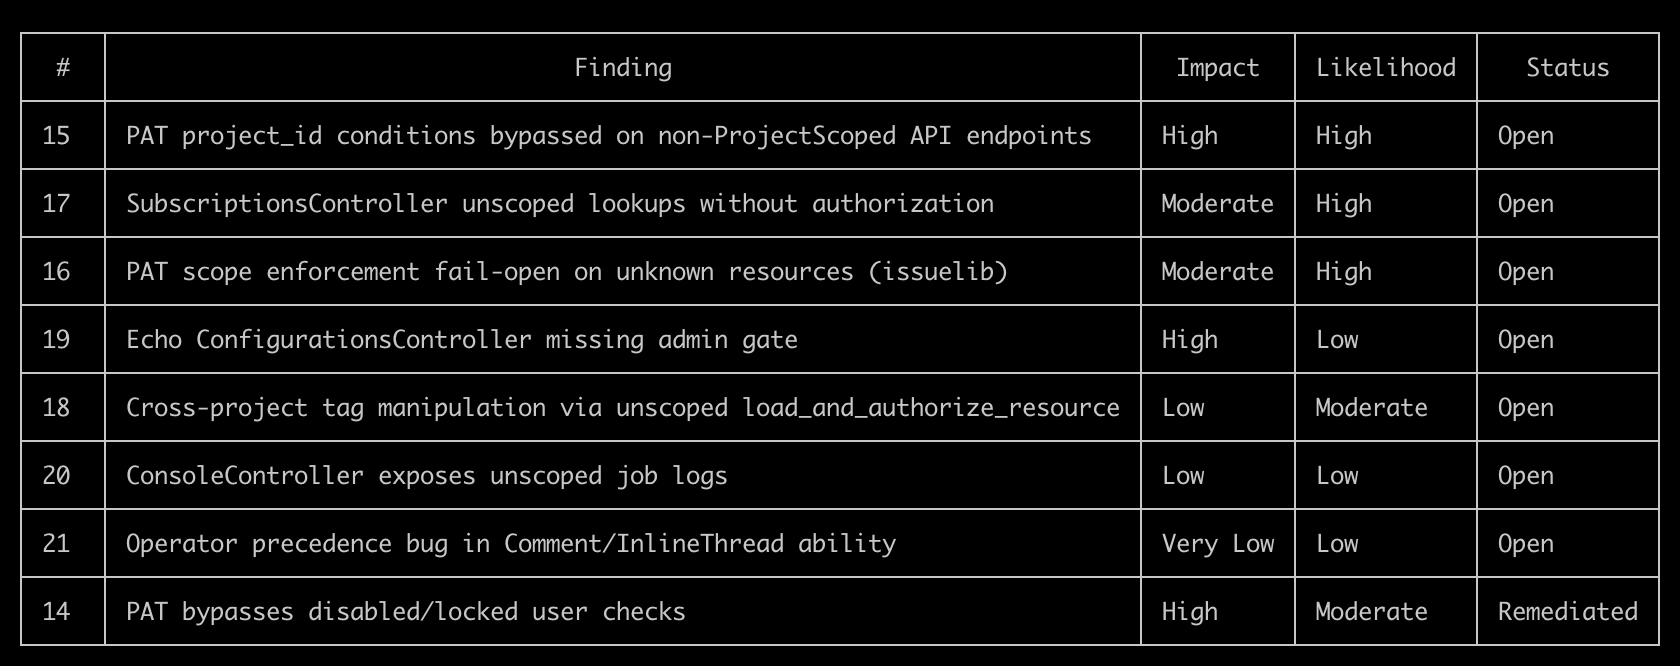
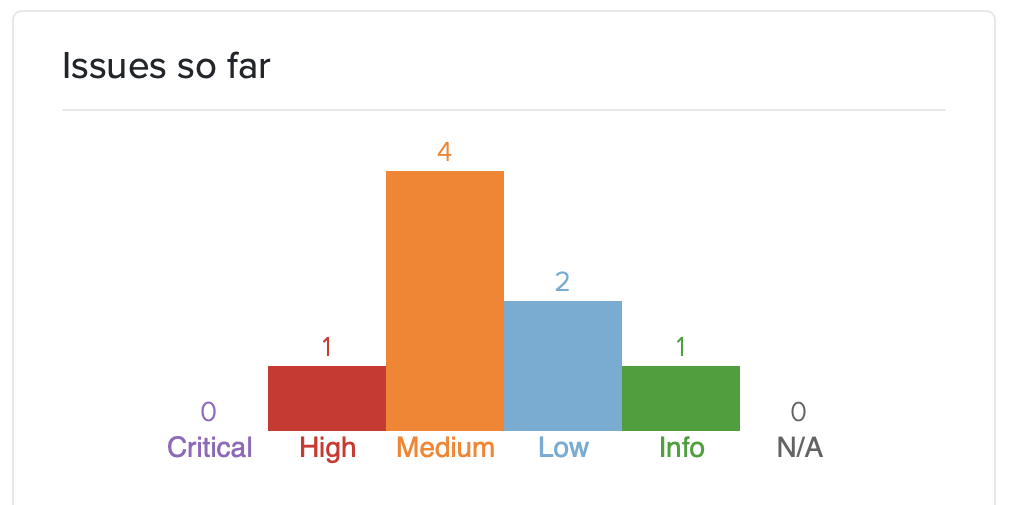
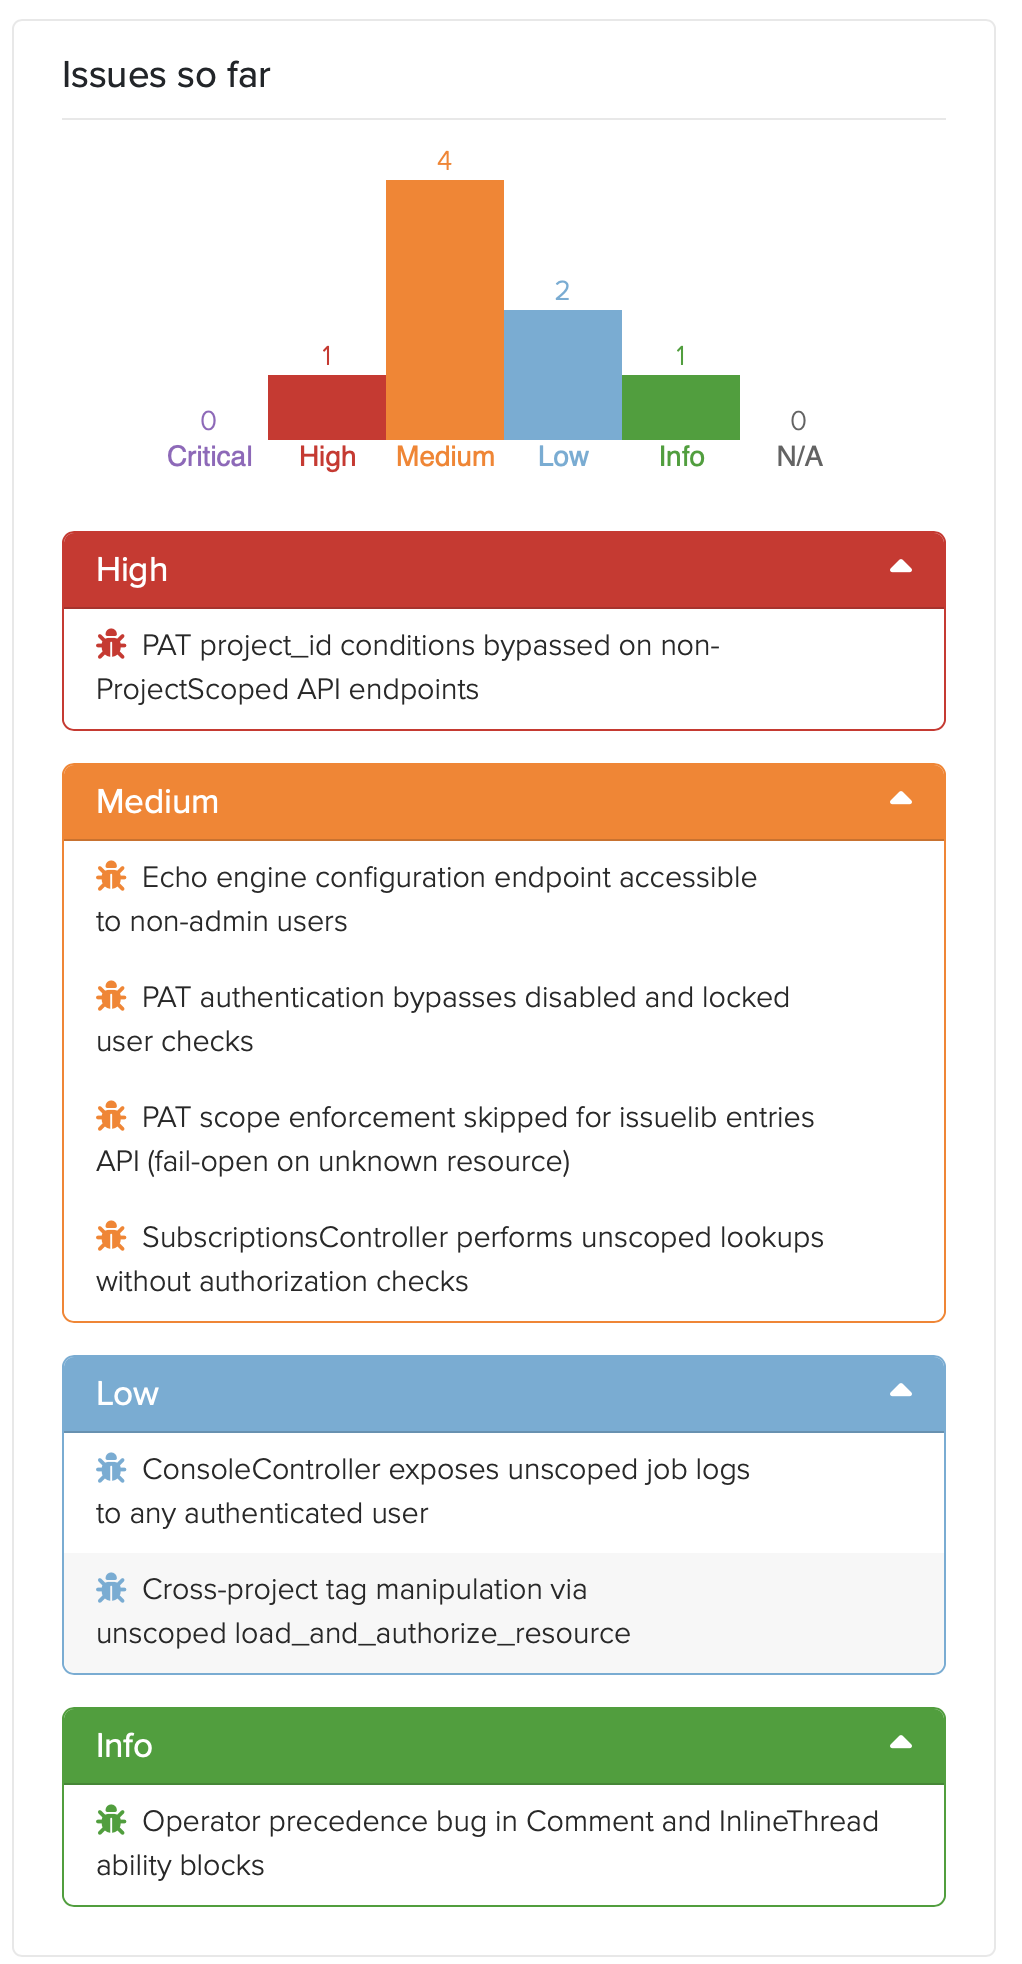
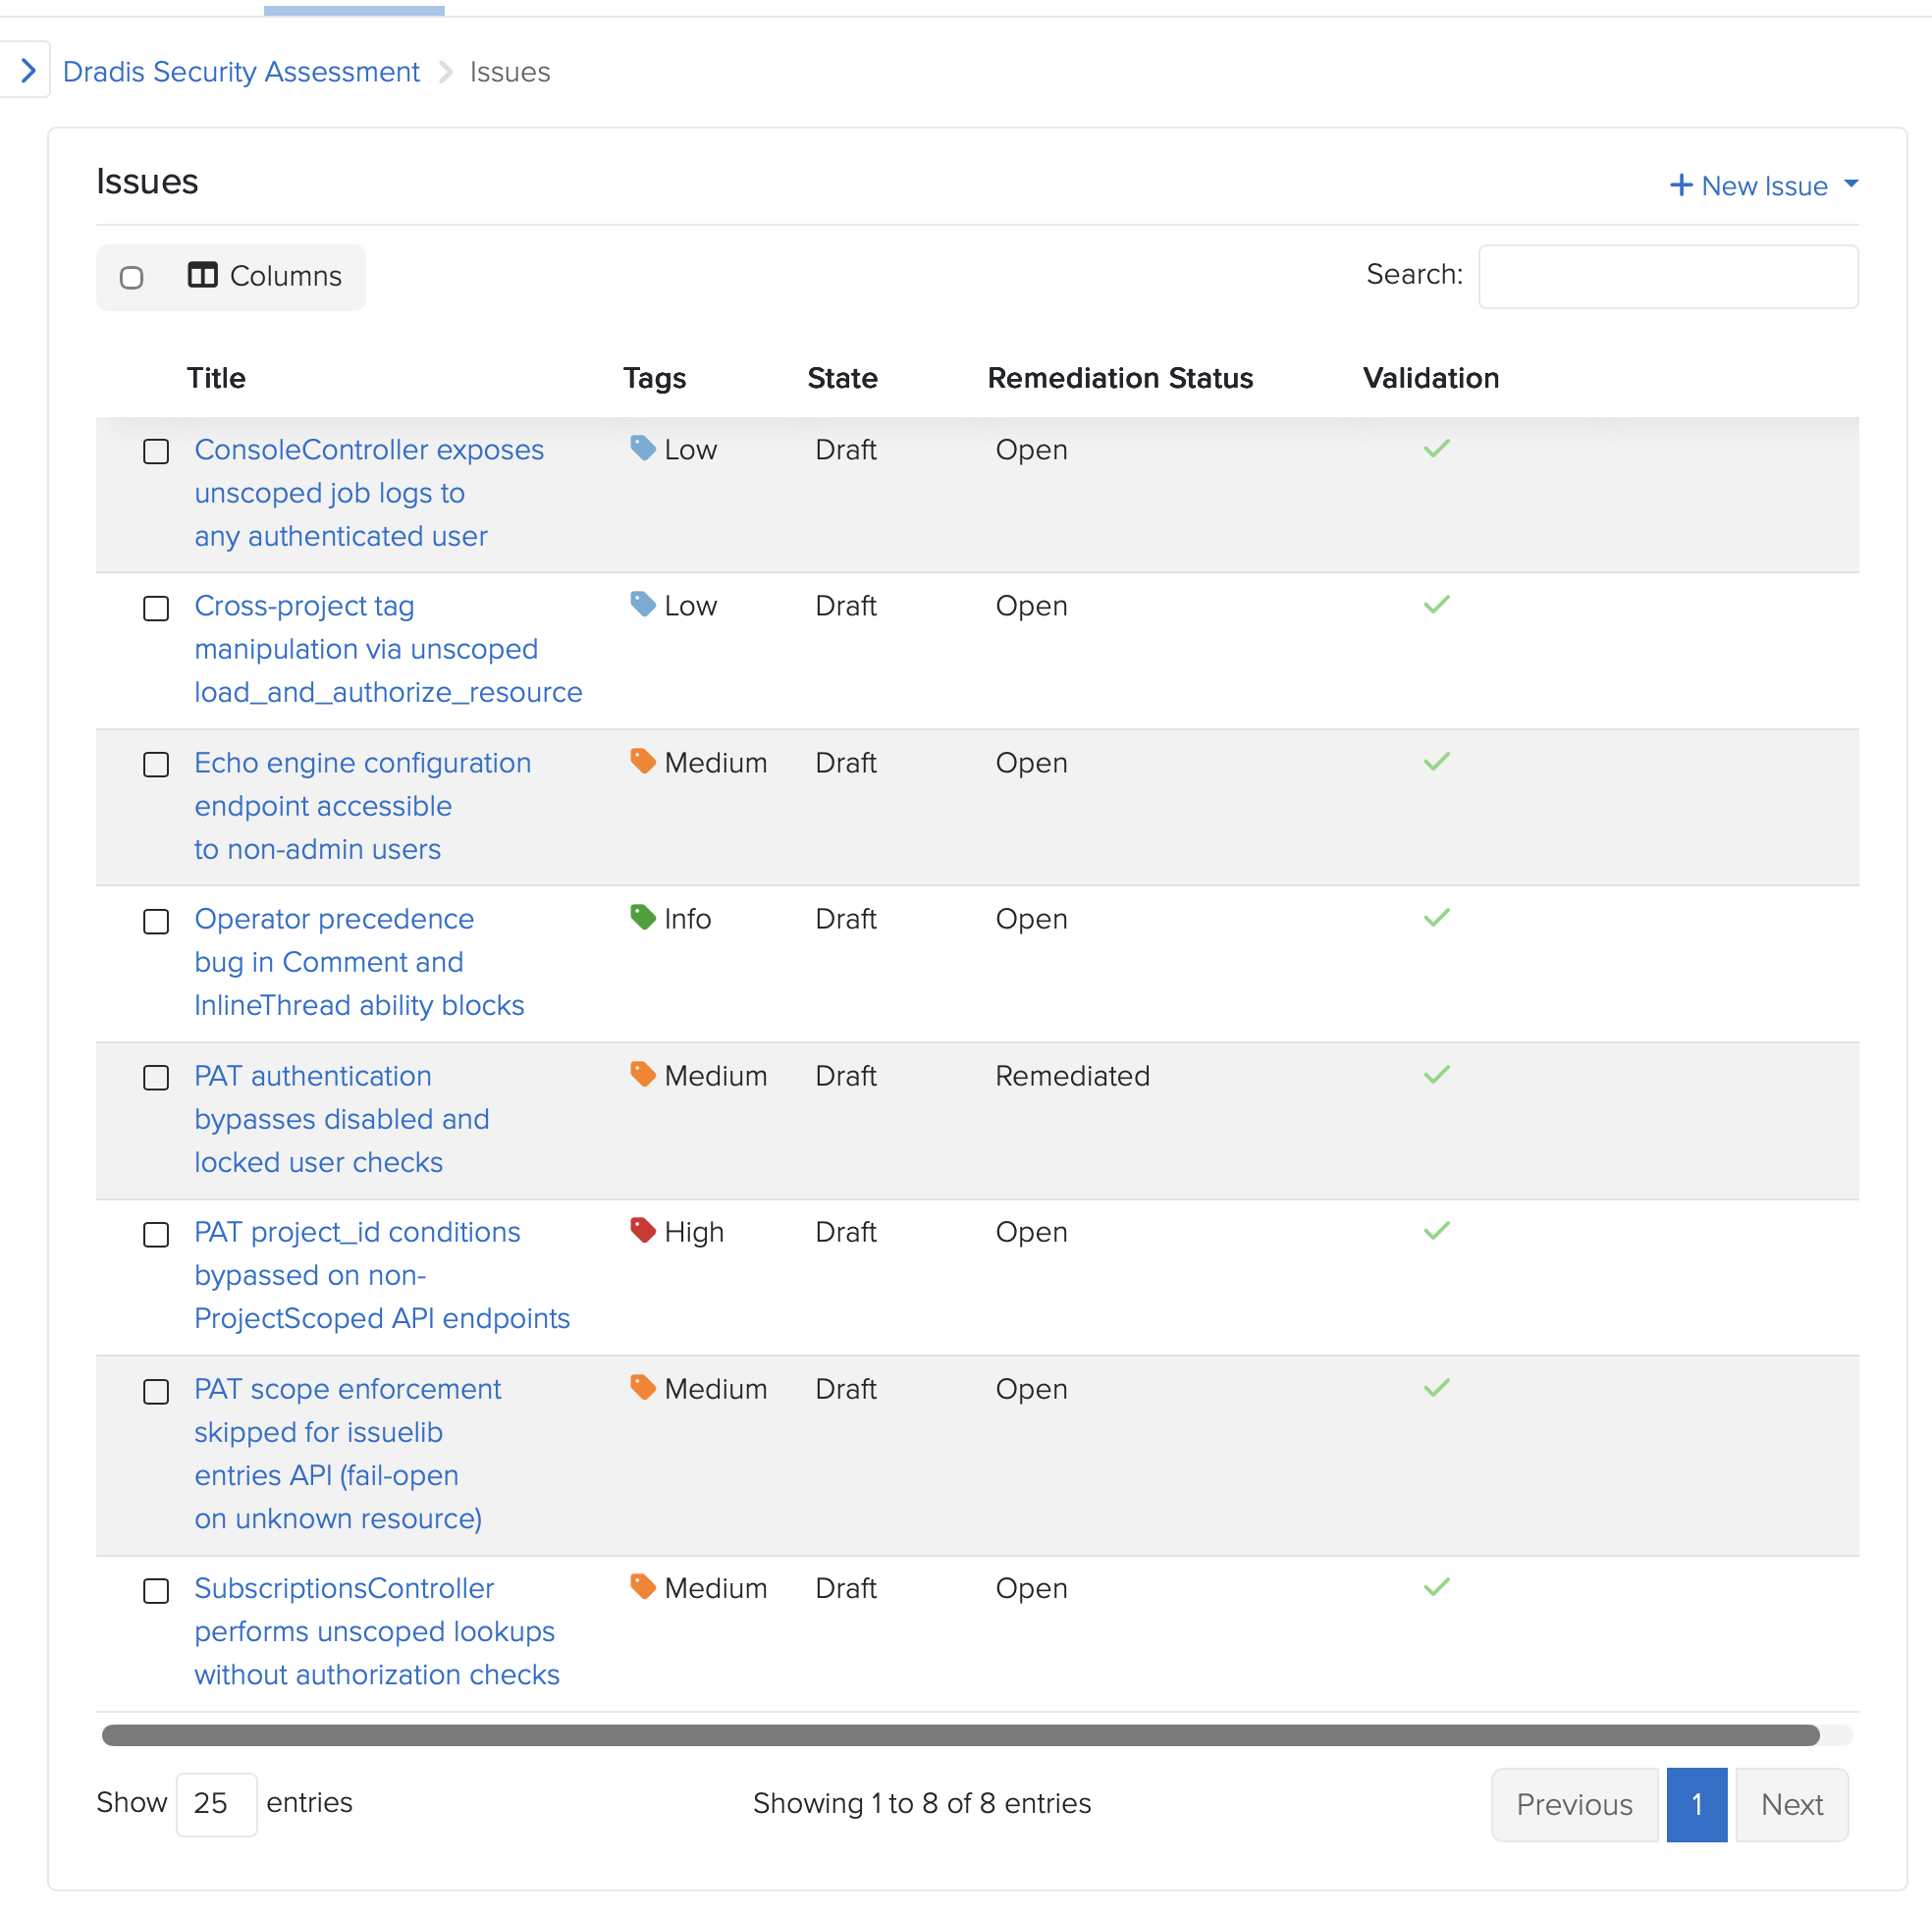
The eight findings
The audit surfaced eight issues. Severities spread from CVSS High down to Info. Click for more details:
Personal Access Token authentication didn’t check whether the authenticating user was disabled or locked. Every other Warden strategy in the codebase did. The new PAT strategy, shipping for the first time in 5.0, didn’t. Fixed pre-release.
PAT project_id conditions could be bypassed on the direct /api/projects endpoints. The condition system expects a Dradis-Project-Id header; the direct-projects controller reads the project from URL params. A PAT restricted to “project 2 only” could read project 1 by omitting the header. Fixed pre-release.
PAT scope enforcement failed open when a controller’s resource name wasn’t in the allowed list. A new engine forgetting to register its resources would silently grant full access. Flipped to fail-closed. Fixed pre-release.
SubscriptionsController had no authorization checks. Any authenticated user could subscribe to, or enumerate subscribers of, any resource across any project. A real shipped vulnerability in both CE and Pro. The CE-side fix is public at dradis-ce#1563 and the vuln report in our Security Reports page.
Cross-project tag manipulation through an unscoped load_and_authorize_resource. Pro-specific vuln; the controller-shape fix went to CE too for code parity (dradis-ce#1563 covers the refactor that landed alongside the subscriptions fix).
Echo configuration UI was accessible to non-admin users in Pro deployments. Dradis Echoshipped in 4.19 as a separate addon. Dradis 5.0 takes it out of Beta and includes it in the main framework, so this never reached a public version. The admin gate landed pre-release at dradis-ce#1565.
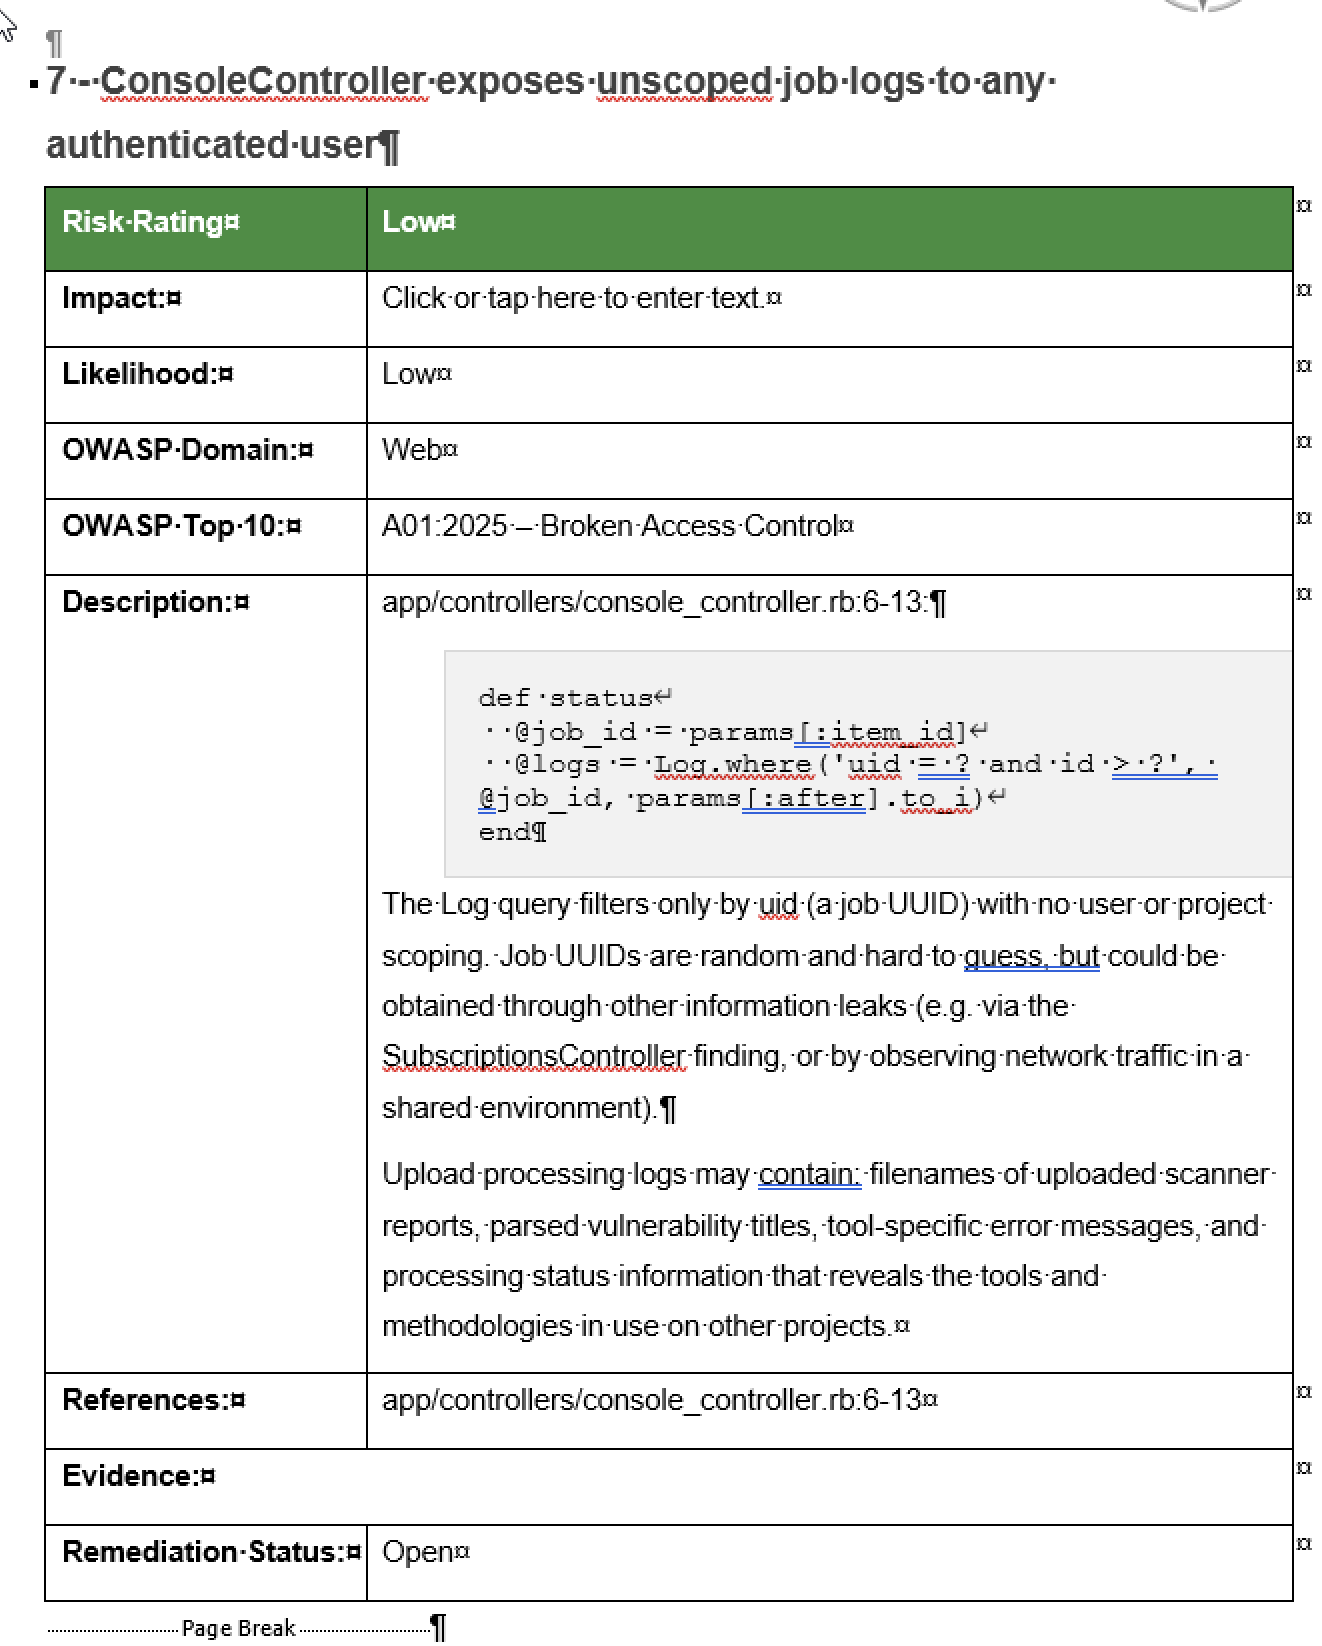
Console job logs not scoped per user. After investigation, accepted as a capability-token design: the job UUID is server-generated via SecureRandom.uuid, 122 bits of entropy, only returned to the initiating user and short-lived. The documentation landed at dradis-ce#1564 so the design intent is recorded in the code where the next person looking at it will see it.
A latent operator-precedence bug in the Comment and InlineThread CanCan ability blocks. Not exploitable under shipped ability rules. Still fixed defensively, because the next engine that adds a can :read ability on a commentable type would have silently opened a hole.
The full public advisories are on the Dradis Security Reports page. CHANGELOG entries are dated and in the 5.0.0 release notes.
Dradis tracking the Dradis audit
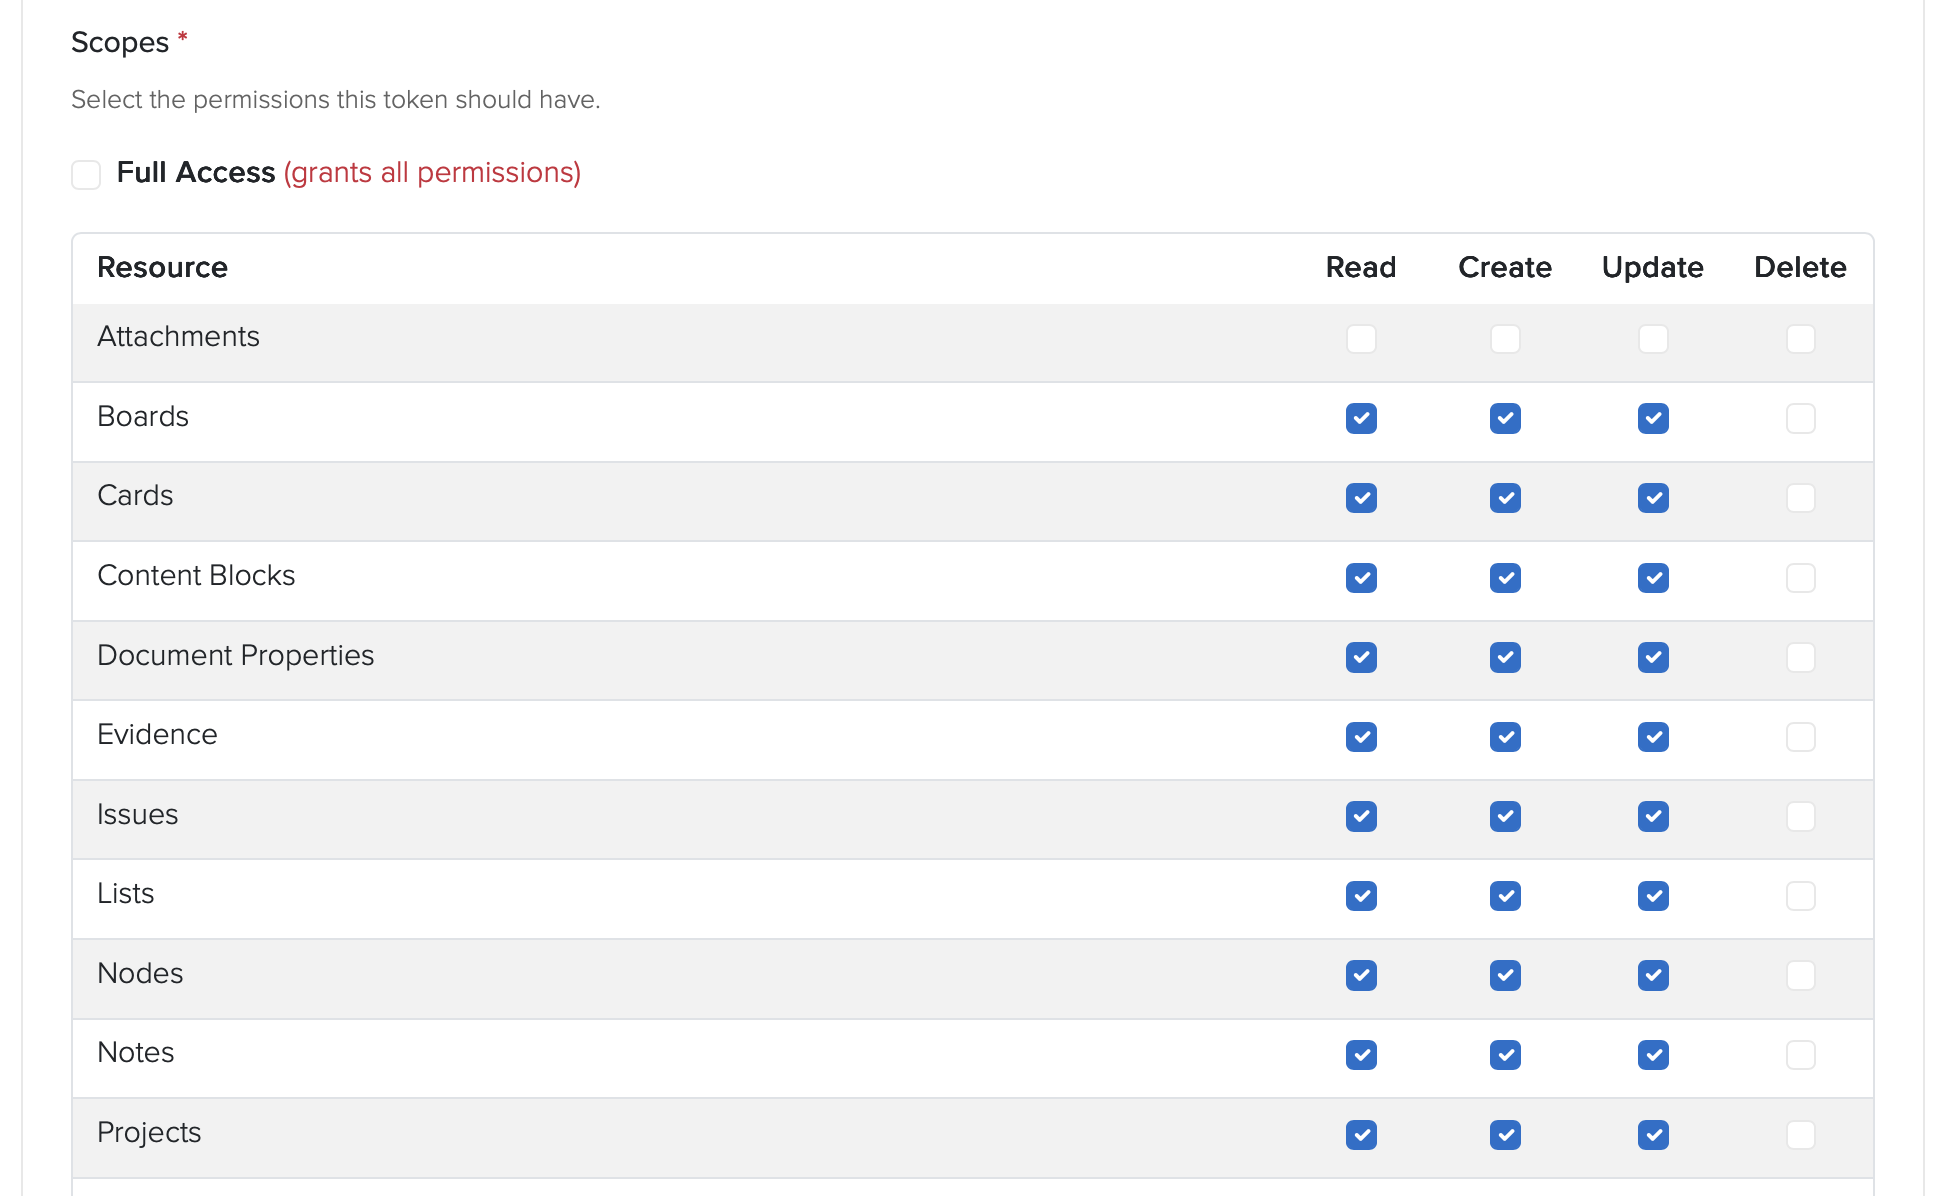
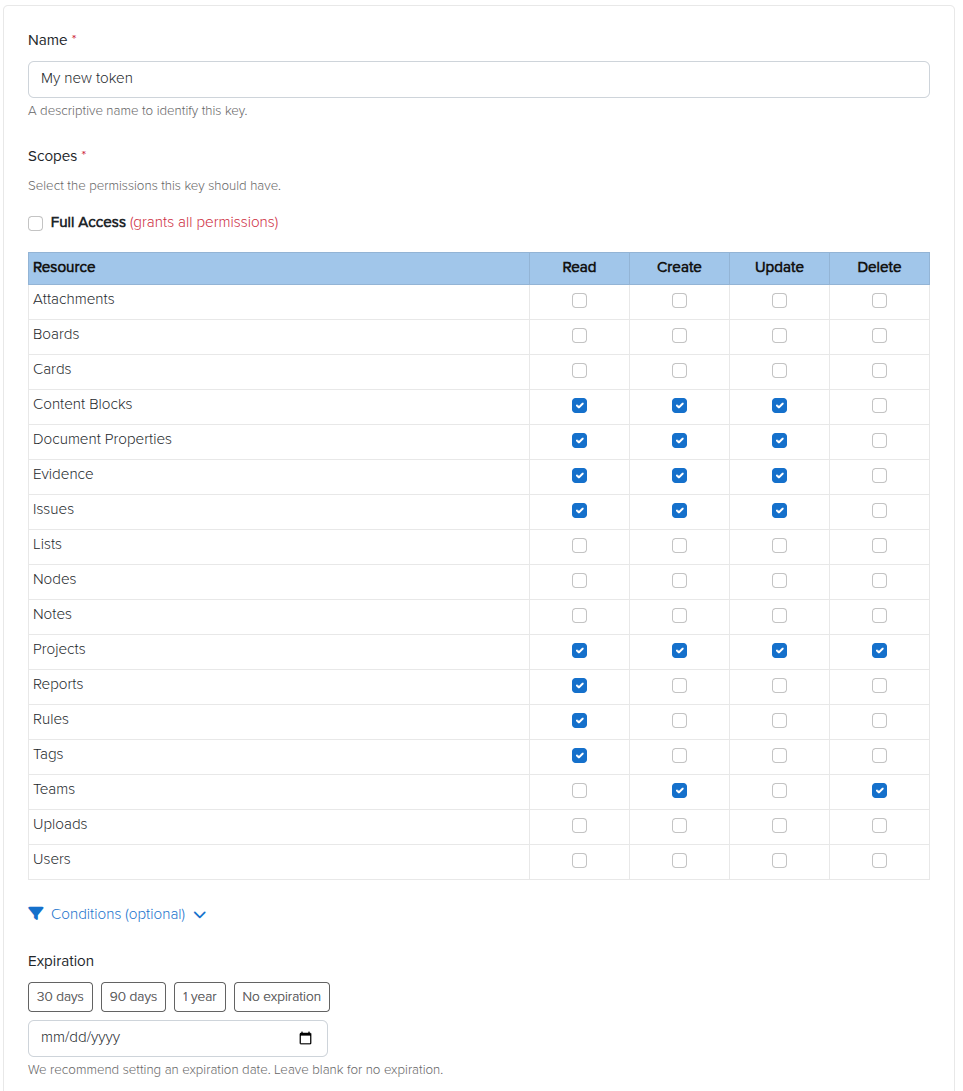
Granting Access
It was a great opportunity to test-drive our new Personal Access Token feature that allows user to create restricted access tokens for integrations or tools. We gave full Project access:
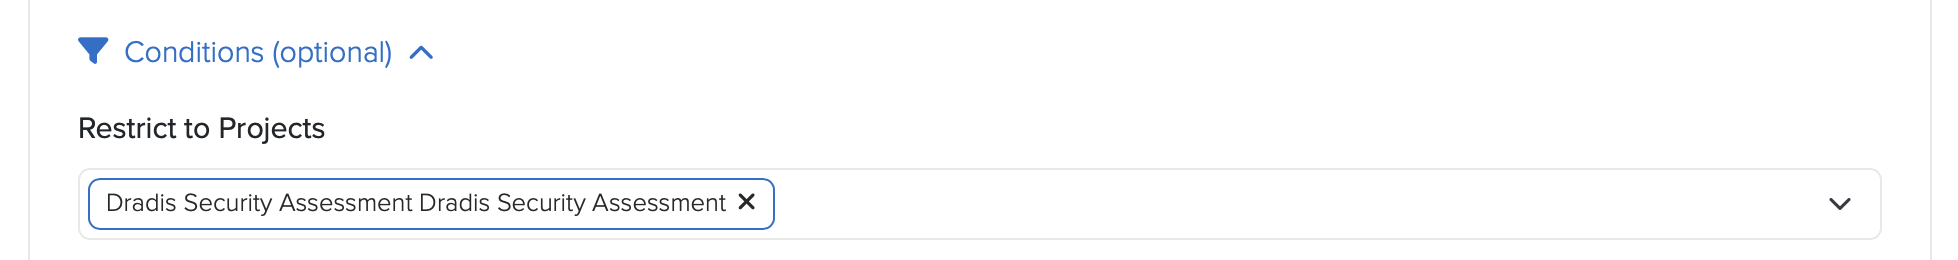
And then narrowed down to a single Project:
And set a 30 day expiration:
Gave the generated PAT to Claude and asked it to test access:
⏺ Good — API works, issue created. Let me delete that test issue and start the real audit.
This is the part that still feels absurd when you say it out loud. The OWASP Top 10 2025 kit we were about to ship in Dradis 5.0, the methodology, the sample project, and the three report templates, were used to run and document the audit on the codebase that was about to ship them. The reporting tool reported on its own vulnerabilities, using its own brand-new methodology content, while the release that introduced that content waited for the audit to finish.
Dogfooding is a cliche. This was the literal form of it. If the kit doesn’t work for organizing an eight-finding audit under time pressure, we don’t ship the kit. The kit worked. The findings are in Dradis. The Dradis findings were used to drive the Dradis fixes. The fixes shipped in Dradis 5.0 alongside the kit.
“You got lucky”
AI-assisted security work has a known failure mode. Models assert things with absolute confidence, including things they have not actually verified. Experienced operators learn to hear the tone and push back before an assertion becomes a design decision.
One concrete example from this audit: While fixing the cross-project tag manipulation issue, Claude asserted that a particular CanCan ability tightening could not be ported from Pro to CE because of a framework limitation. The reasoning sounded plausible. It was plausible. But the reviewer had seen this pattern often enough to flag it.
“Unless you confirm this as a limitation with CanCan, I don’t buy your argument.”
The assertion got tested. It was correct. The exact error, from CanCan’s internal accessible_by when building SQL for an association that doesn’t exist in one of the two repos: NoMethodError: undefined method 'klass' for nil. Real limitation. The fix landed.
The reviewer’s response: “You got lucky.”
That is an important moment in AI-assisted engineering. Not when the model produces output, but when the operator decides whether to trust it.
The model had produced a confident, specific, mechanically-plausible claim, and it happened to be right. It also could have been wrong, and if it had been, we would have shipped a broken CE refactor and a misleading commit message explaining why.
The lesson is not “AI is unreliable.” The lesson is that AI-assisted engineering without an experienced operator calling bluffs on overconfident output is not engineering. It is rolling dice on production code. The same discipline applies whether the output is a bug report, a fix proposal, or an architectural justification.
Trust, then verify. Every single time.
The AI-assisted code review pipeline is why this fit in 48 hours
The 48-hour turnaround was not possible because of Claude alone. It was possible because Dradis already runs an AI-assisted code review pipeline as part of the standard PR workflow. That pipeline reviewed the audit’s own fixes.
One of the PRs in the audit received an automated review from a separate agent. The review flagged a real edge case in the fix: an empty allowlist in a personal access token’s project conditions passed the present? check as false, so the token’s index endpoint still worked, while every member action returned 403. Incoherent behavior. The review caught it, the fix was tightened to use Hash#key? instead of present?, two regression tests were added, 27 examples continued to pass, and the PR merged cleaner than it started.
That review happened on an audit fix, by an AI agent reviewing AI-drafted code, and it caught a real bug.
This is what enabled the 48-hour window. The audit found eight things. The fixes needed to be reviewed in the same window. A team relying only on human reviewers to triage eight security PRs in two days produces either careful work or fast work. Not both. The AI-assisted review pipeline, already running against every PR on this codebase, turned “fast enough to ship on time” and “careful enough to ship safely” from competing constraints into complementary ones.
Ongoing AI-assisted audits are now part of our release pipeline. The 48-hour window was a one-time event driven by news. The audit pattern it used is now continuous, running against new code as it goes in, in the same pipeline that already checks everything else.
What this means, and what it doesn’t
What this means is not that AI replaces security engineers. The audit identified eight findings. A human with 20 hours of focused attention on the same codebase would have identified findings too. Possibly a different eight. Possibly overlapping. What AI-assisted audits change is the frequency and breadth. You can do this more often, across more surface area, with cost low enough that it becomes continuous rather than event-driven.
What it doesn’t mean is that the data is safe to send anywhere. This audit ran against a Rails codebase on engineer laptops. The prompts contained code, and the code contained architectural details of a commercial platform. Had this been a customer’s code, under NDA, the same prompts would have been a meaningful data exposure. We’ve covered the use of “Shadow AI” in pentesting before. It is also why Dradis Echo exists: local Ollama, no external API calls, scoped permissions. AI-assisted work on data that cannot leave your environment requires AI that runs inside your environment.
And what it especially does not mean is that your security platform should pretend to not need audits. Every security tool will be audited eventually. The question is whether the vendor audits first or a customer does. The week the two largest AI labs released models purpose-built for offensive security work is the week every security tool vendor should have run one of those models against their own code. That we did, in 48 hours, using our own product to track the work. We see it as the baseline a serious tool should meet.
Evaluating Dradis for a regulated environment? The audit is proof of one thing: the code is inspectable, the fixes are public, and the team that writes it will tell you when they find a bug in it. If that matches your procurement criteria, book a demo and we’ll walk through the deployment and audit approach with your team.
Practical next steps if you want to do this on your own code
If you want to run a version of this audit on your codebase, not every piece requires the same tooling we used. The shape generalizes.
Build the primer first. One warm session with a frontier model, focused on architecture. Authentication, authorization, request-flow scaffolding, known-intentional patterns. Stop there. Commit the artifact. Every downstream scan reads it.
Narrow the file list to the audit surface. Routed entry points, jobs that consume user input, serialization boundaries. Not templates, not schema files, not vendored dependencies.
Use a cheaper model for the per-file pass, a stronger one for the primer. The primer is a one-time structural read. The per-file scans are stochastic pattern-matching against the primer’s context.
Track every candidate finding in a reporting tool. Title, affected paths, reproduction, severity. If you use Dradis, we open-sourced the OWASP Top 10 2025 kit that shipped in 5.0 has a methodology and templates sized for this shape of work. If you don’t, any structured tracker works. The point is that findings stay in a system where they get triaged, not a chat log.
Have an operator who will push back on confident-sounding claims. Every asserted framework limitation, every claimed impossibility, every “this can’t be done because,” gets verified. Every single one. That is the job.
Wire the audit into the ongoing pipeline, not an annual event. The 48-hour turnaround was a news-driven intensity burst. The steady-state version is AI-assisted review against every PR, against every new entry point, continuously. That is what catches the next finding before it ships.
FAQ
Did Claude find everything?
No. That’s not the right question. The question is whether AI-assisted audits find things humans miss and vice versa. This audit surfaced eight findings. A human with the same time budget would have found some overlap and some gaps. The value of AI-assisted auditing is breadth and frequency, not replacement.
What model did you use?
A single Opus session produced the primer. The per-file scans used a mix of Opus and Sonnet depending on file size and suspected complexity. Total spend for the audit was well under a single engineer-day of time at equivalent billable rates.
Why publish this? Doesn’t it invite attackers?
Two reasons. First, the fixes shipped before this post did. The findings described here are closed. Second, a serious security posture is not a secret. Customers evaluating Dradis for regulated environments ask specifically for evidence of how we operate internally. Posts like this are the evidence (but of course, there’s more evidence from industry 3rd parties). A vendor who won’t tell you how they audit their own code is a vendor asking you to trust them without proof.
Is Dradis audited by third parties?
Yes. This post describes an internal AI-assisted audit specific to the 5.0 release. It is not a substitute for third-party penetration testing or code audit. Our customers cannot avoid running their own audits on the code they self-host. It’s in their nature 😂
Can I use Echo for this kind of work?
Echo is designed for report-writing assistance (finding descriptions, remediation language, CVSS scoring), not for code audit… yet. The architecture (local Ollama, no external API, scoped permissions) is the same principle, but the model sizes and prompt patterns are different. We used Claude Code and Codex for code audits specifically.
What about the findings that were accepted rather than fixed?
Finding 7 (console logs not scoped per user) was accepted as capability-token design after analysis. The reasoning is documented in the code itself at dradis-ce#1564. The summary: the job UUID is server-generated, random, only returned to the initiating user, and treated as the read capability for the associated logs. Adding row-level scoping would have required a migration and threading user context through 25+ call sites across core and every upload plugin. The cost was not proportionate to the residual risk, and the design intent is now recorded, where a future maintainer will see it. These logs are also garbage-collected daily.
What we learned that will change how we ship
Three things, all of them boring.
First: the primer-first pattern beats brute force on cost, speed, and output quality. We will use it again, and we will recommend it to teams asking us how we did this.
Second: AI-assisted security code review as a continuous pipeline (not an event) is the thing that made the 48-hour window possible. We had already been running one for general coding, now we’ve added the security review flavour. Teams that want the 48-hour capability need to build theirs before the news arrives, not after.
Third: the OWASP Top 10 2025 kit that shipped in 5.0 (methodology, sample project, three report templates) was battle-tested on an actual eight-finding audit under time pressure before it reached a single customer. That’s a better confidence signal than any launch blog could have delivered.
See how Dradis handles this in practice The audit turnaround, the OWASP 2025 kit, and the AI-assisted review pipeline are all part of Dradis 5.0. The code is self-hosted, the core is open-source, and the security fixes from this audit are in public CE PRs you can read. If you’re evaluating platforms for a regulated environment, book a demo and we’ll walk through the deployment architecture and what this kind of audit looks like against your own team’s code. If you’re here for the AI-security angle and want to see how local AI fits into a pentest workflow, that’s the Echo page. Self-hosted, Ollama, no external API.
This is an exciting release. We’ve kept working on the basics: making the reporting engine even more poweful (image and paragrapha alignment, border styling, image sizing), GitHub style in-line comments, dark mode,…
At the same time evolving the platform for what comes next: faster and easier deployments and upgrades, fine grained API access to unlock agentic workflows, built in context-layer so you can Bring Your Own LLM.
Have a look, let us know what you think and what you build on top of the platform.
Enjoy!
Docker deployment
Dradis is now available for Docker. No more dealing with hypervisors or downloading hefty VMs and upgrade files. All Dradis add-ons for your subscription level will also be pre-installed, so setup, configuration, data migration, and upgrades should be a breeze. Getting started with Docker couldn’t be simpler:
curl -fsSL https://get.dradis.com | /bin/bash
Dark mode
A much-requested feature is here at last. You can now enable dark mode across Dradis, or the auto mode that switches between light and dark mode based on your system preferences. Eye strain will be less of a factor after extended Dradis use!
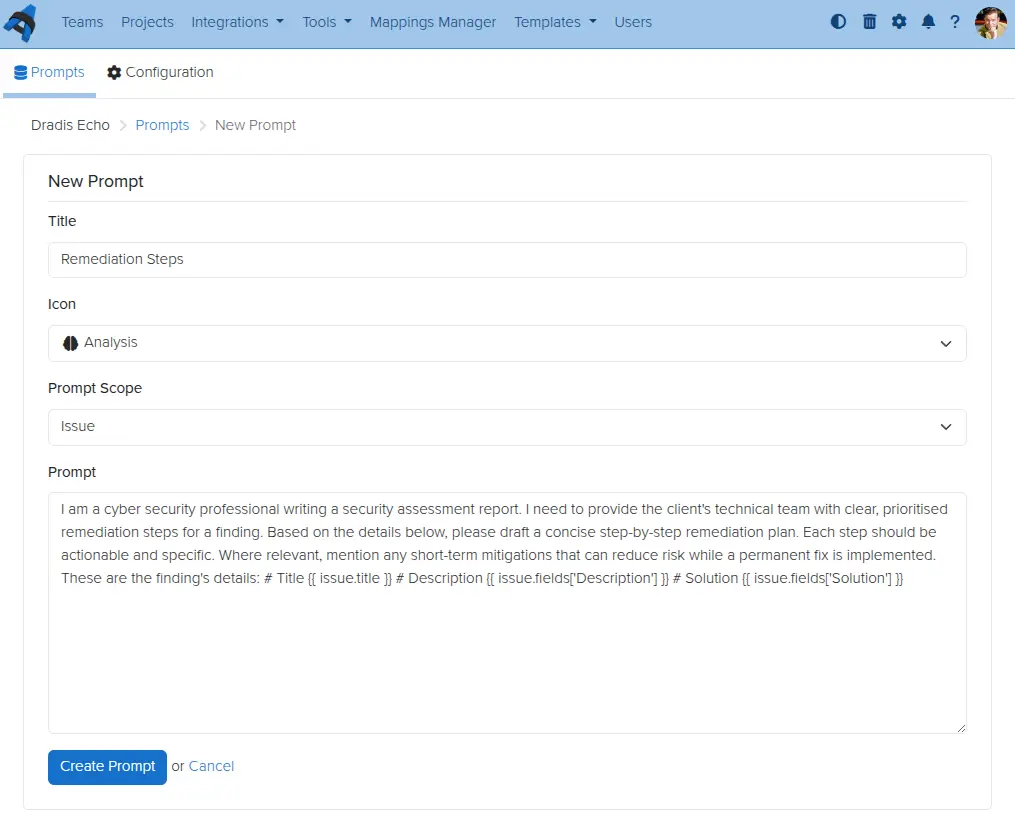
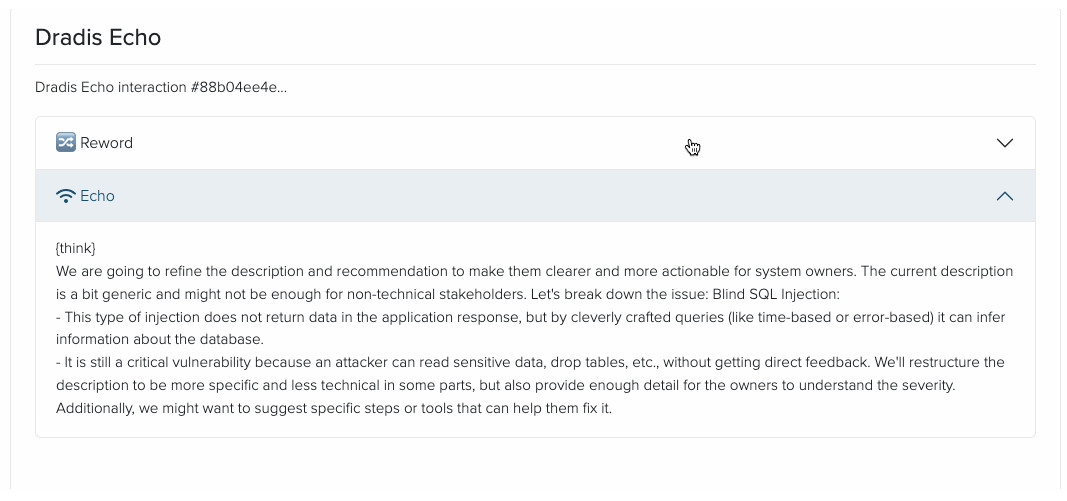
Dradis Echo: Configurable user prompts
Dradis Echo, which lets you connect your Dradis instance to a local LLM, can now have custom prompts defined by you. Create prompts, define their scope, save, and use them wherever you want.
Business Intelligence for contributors
Read-only Contributor users in Dradis can now be given access to even more features and data within Dradis. The latest addition is access to Business Intelligence data for projects to which they have been assigned. For example, perhaps a project manager needs to see trends of recurring issues over multiple retests for a single client, but you have no other need to give that person a paid license seat. Simply add them as a contributor user, assign them permissions for the projects they need to look at, and they will be able to see all they need on the results portal.
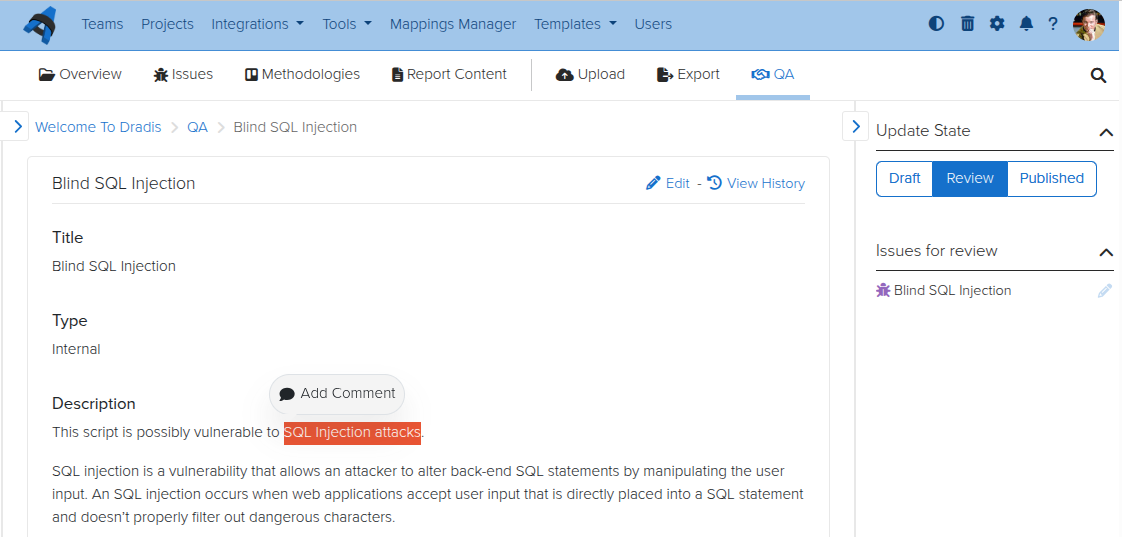
Inline Comments in QA
For teams using the Quality Assurance feature in Dradis, some feedback we have heard frequently is that inline comments would be helpful to discuss specific items among the reviewer and tester(s). Now you can do so, with the QA inline comment feature. No more hunting through comment sections for relevant discussions – go line by line and open threads as necessary.
Personal Access Tokens
We reworked API keys so that you can now have scoped Personal Access Tokens (PATs). Instead of using keys that belong to one user but have that user’s access across the board, you can now have a scoped PAT with limited, granular, specific access. Create tokens at will for your API integrations, giving Create, Read, Update, and/or Delete permissions to each individual content type in Dradis. Set expiry dates and conditionals if you like, and create as many as you would need.
Release Notes
Activities:
Remove ActivityTracking for Issues and use EventPublisher
Background jobs:
Migrate recurring tasks to SolidQueue
Business Intelligence:
Allow author/contributor access to Business Intelligence
Docker:
Integrations: Include assets for all integrations regardless of enabled/disabled status
Update Dockerfile and add Docker Compose config file to enable Docker deployment
Update default attachments, templates and themes locations to storage/
Echo:
Add configurable, reusable prompts for Issues
Forms:
Improve visibility of form actions
Kits:
Include ‘sort_field’ in export to preserve issue sorting on re-upload
Layout:
Add light/dark/auto theme toggle to support dark mode
Nodes:
Add more types and icons
Rename upload and parent node types and add distinguishing icons
Update associated evidence, notes and child nodes’ updated_at columns on node merge
Warn on node merge that methodology will not be copied
Profile:
Update default user avatar
QA:
Add inline comment threads for Issues
Report Template Properties:
Validate sort field is numeric
Results Portal:
Manage project access and contributor assignments
Sidebar:
Add resize functionality
Keep sidebar open when editing issues in large viewports
Display validation when creating and editing issues
Textile:
Add support for paragraph alignment
Add support for image resizing, alignment, and borders
Usage tracking:
Send the on/off event always
Webhooks:
Add Issue CRUD webhook events
Add Project CRUD and state transition events
Add Results Portal Project CRUD webhook events
Wizard:
Mark as done after Kit step, without waiting for the background job
OWASP kit: add with 3 report template variations
Red Team kit: add with MITRE ATT&CK methodology and kill chain report
Welcome kit: update with OWASP Top 10:2025 methodology
Upgraded gems:
faraday, nokogiri, rack
Bug fixes:
Configuration:
Require integer settings to be positive numbers
Issues:
Render ‘Default’ option in New issue dropdown when issue fields are defined in the Report Template
Whitelabling:
Fix logo not appearing after uploading a new one in the admin settings
Integration enhancements:
Azure Authentication:
Add to integrations manager
Duo:
Disable engine by default
Gateway:
Add Athena and Orion themes
Okta:
Add to integrations manager
SAML:
Add to integrations manager
Scheduler:
Add light/dark/auto theme toggle to support dark mode
Reporting enhancements:
Word:
Remove support for the “Description” content control for Cards
Support textile alignment, image size, and image borders on export
REST/JSON API enhancements:
Personal access tokens:
Add multiple, per-user, scoped tokens for agentic workflows
Issues:
Add support for search
Issue Library Entries:
Add support for search
Security Fixes:
Low:
Authenticated (author) persistent cross-site scripting on smart combo component
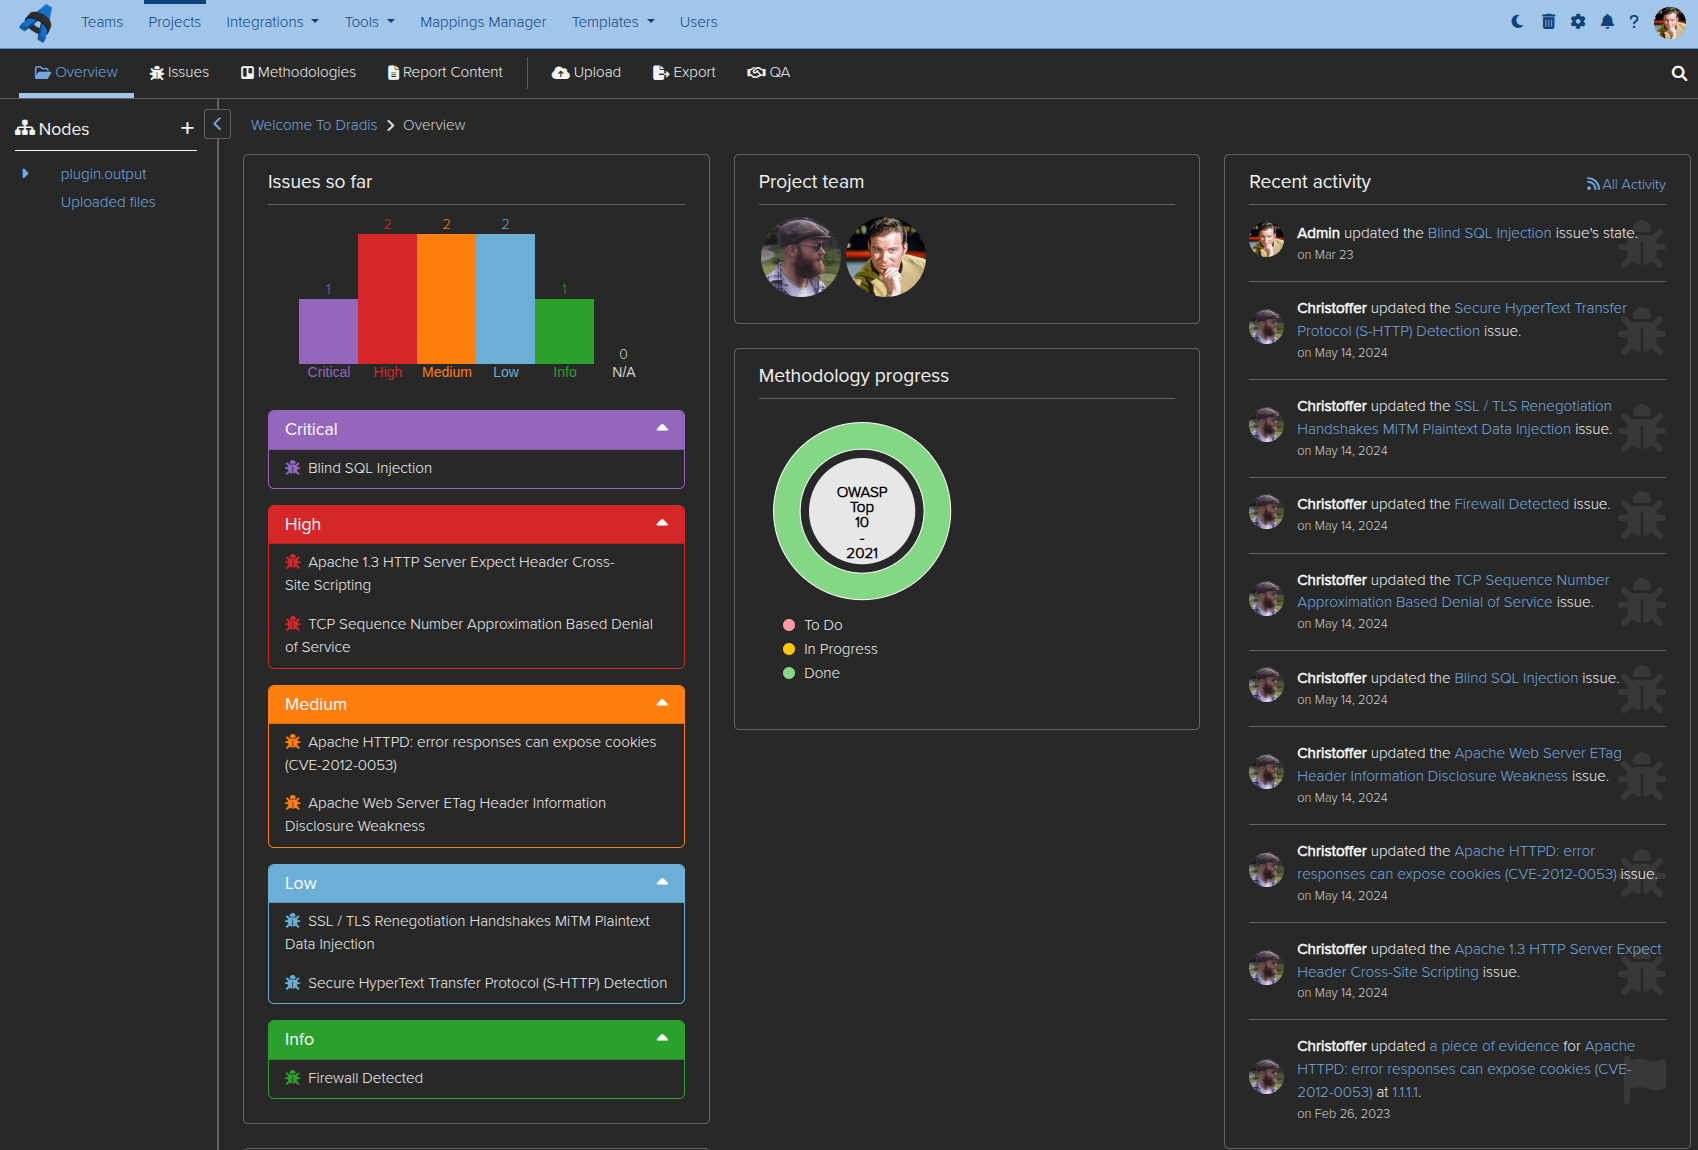
Remember when we shared a “Year in Review” script that could pull basic stats from your Dradis instance? Well, we heard your feedback loud and clear. You wanted more than a command-line script. You wanted insights that were easy to access, customizable to your needs, and powerful enough to help you make real business decisions.
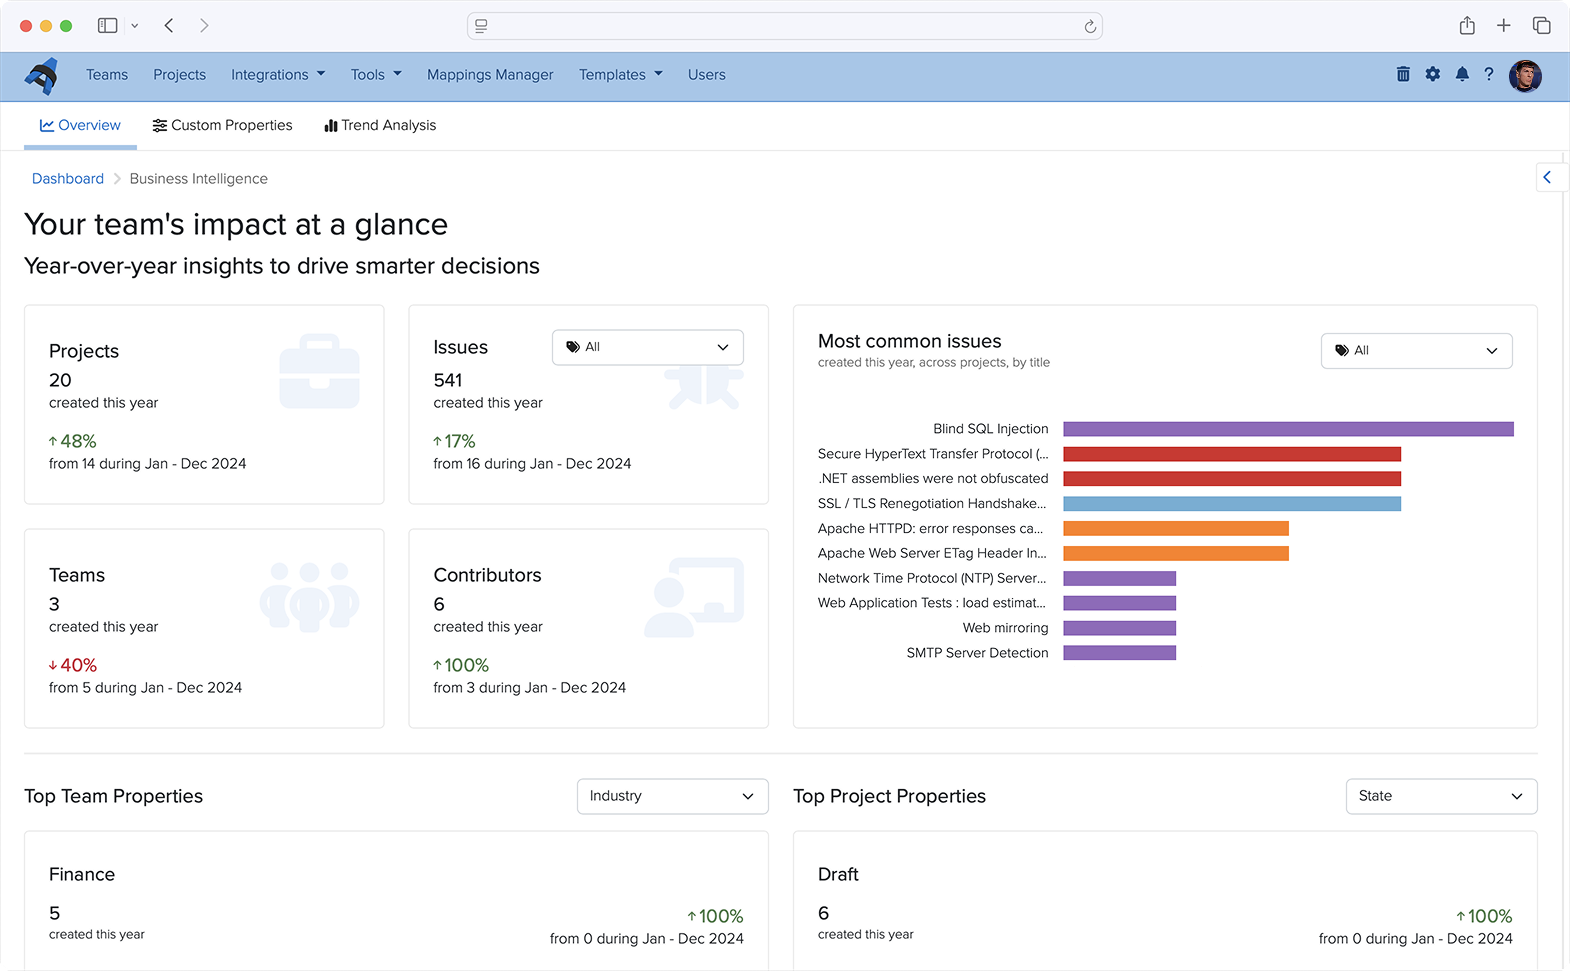
Today, I’m excited to walk you through what we’ve built: a full-fledged Business Intelligence Dashboard that turns your Dradis data into actionable intelligence.
The Journey from Script to Dashboard
That original Year in Review script was simple but effective. It could tell you how many projects you created, count your Issues by severity, and show you the most commonly found vulnerabilities. But it had limitations. You had to SSH into your instance, run commands, and parse text output. And while it gave you a snapshot of your year, it couldn’t help you understand the why behind the numbers.
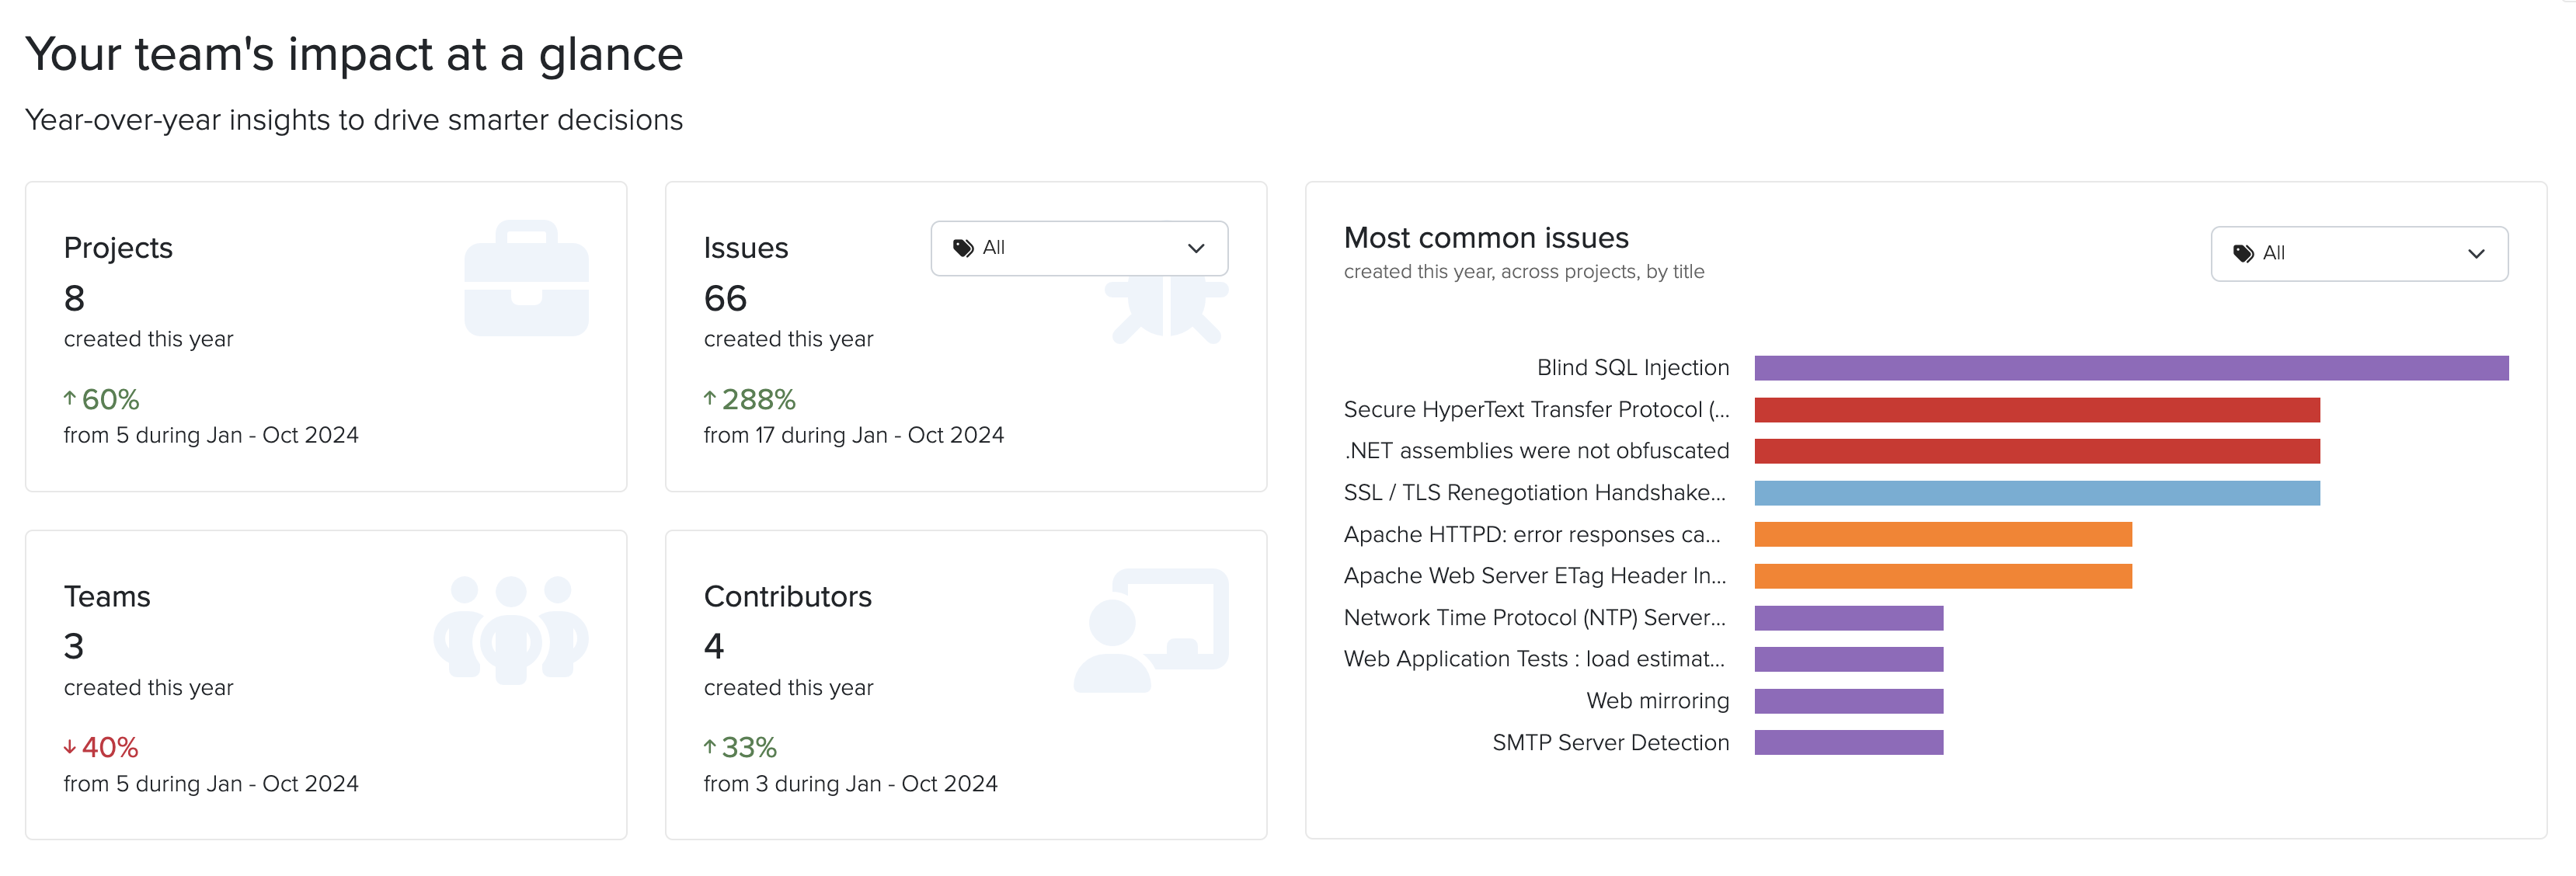
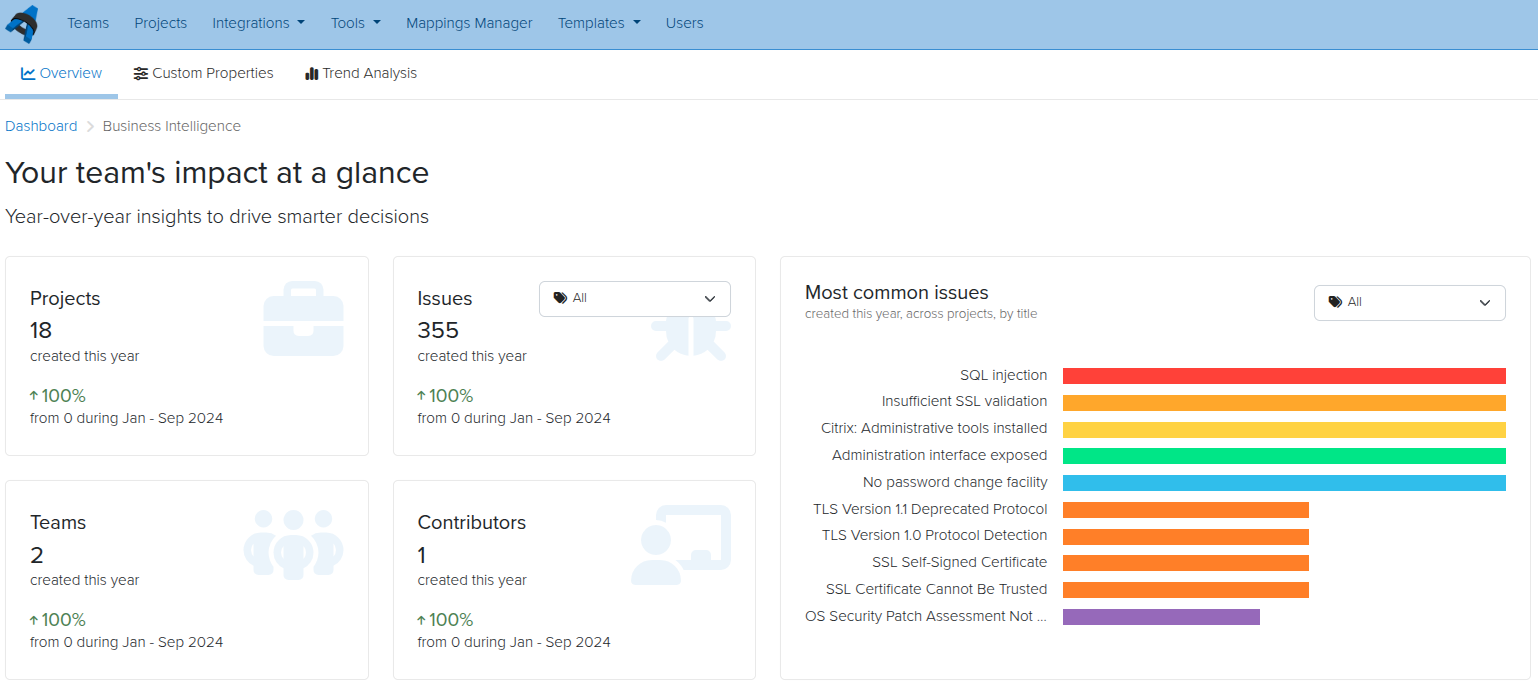
The Business Intelligence Dashboard takes that concept and expands it into something much more powerful. Instead of running scripts, you can now log into Dradis and immediately see:
Activity summaries comparing this year to last year for Projects, Issues, Teams, and Contributors
The most common Issues found across all your projects by Title, filtered by Tag
Custom metrics and trends based on your team and project properties
Custom Properties: The Foundation for Better Insights
The real power of the Business Intelligence Dashboard comes from custom properties. These let you tag and categorize your work in ways that matter to your business.
Team Properties
Want to know which industries you serve most? Or which types of clients are most profitable? Team properties let you define custom fields for your clients. You can create:
Integer fields for numerical data (revenue, number of employees, etc.)
String fields for text data (client contact information, notes)
List fields for categorical data (industry, region, client tier)
For example, you might create an “Industry” property with options like Healthcare, Finance, Retail, and Technology. Once defined, every time you create a new team, you’ll be able to select from these options.
Project Properties
Project properties work the same way, but let you categorize individual engagements. This is where you can track things like:
Project type (webapp, infrastructure, mobile, cloud)
Whether a project was under-scoped or over-scoped
Complexity level
Testing methodology used
These properties become the basis for answering critical business questions.
Existing Business Intelligence Features
Dradis has other Business Intelligence features beyond those we highlighted above. Once you’ve been collecting data through custom properties, the Dashboard transforms that information into visual insights and searchable metrics.
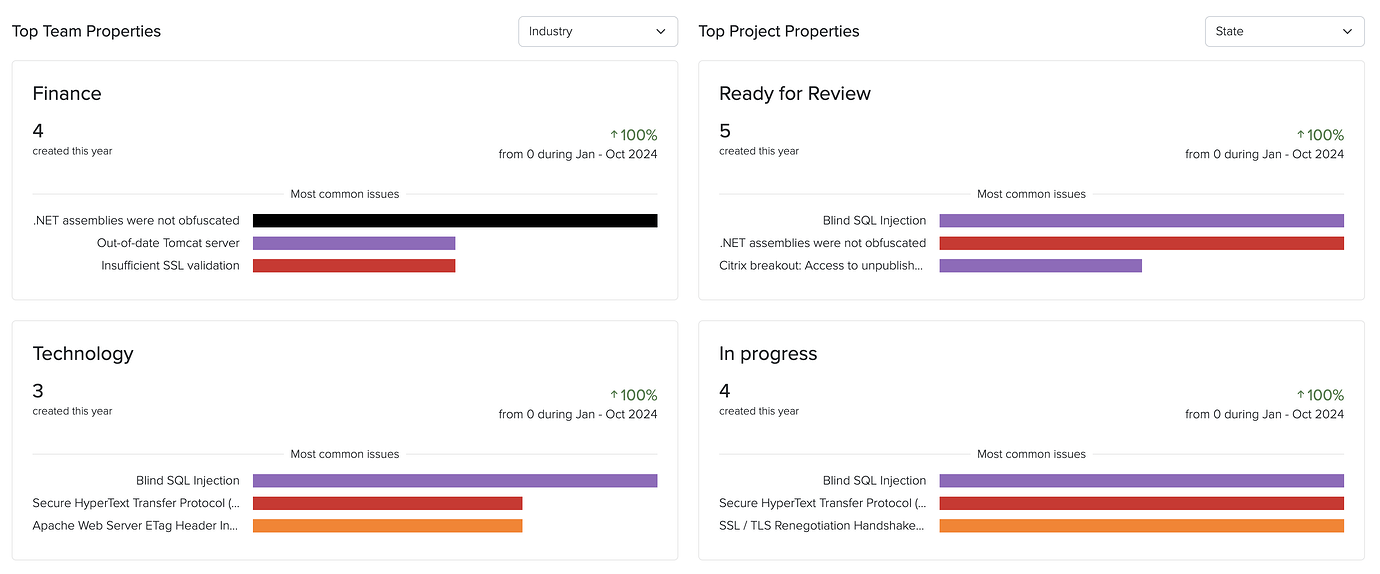
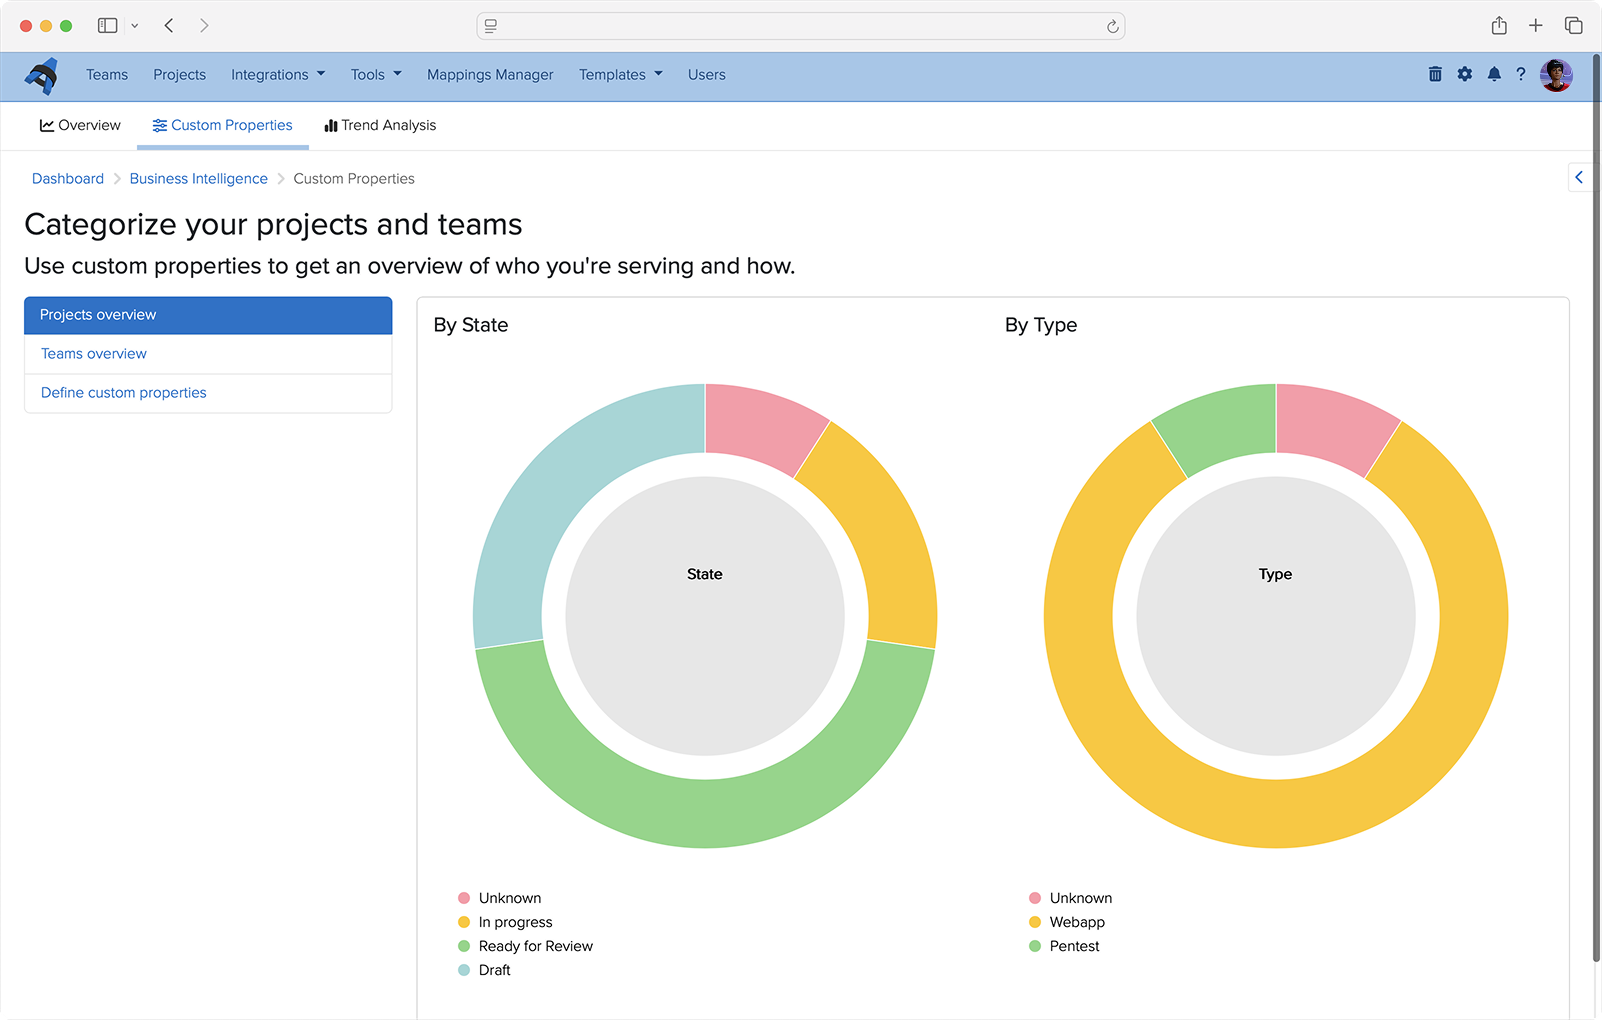
Automated Overview Charts
Every List property you define automatically generates a visual overview chart. These charts give you an at-a-glance understanding of your business composition. See instantly what percentage of your projects are webapp versus infrastructure, or which industries make up the majority of your client base.
Data Analysis Queries
The Data Analysis sidebar lets you drill down into specific questions. Want to see all teams in the Healthcare industry? Or find every webapp project from the last quarter? Just select the property you want to search, enter your criteria, and get instant results.
The results come back in a customizable table where you can toggle columns on and off to focus on exactly what matters. Each result shows not just the projects or teams that match your criteria, but also their associated Issues and other relevant data.
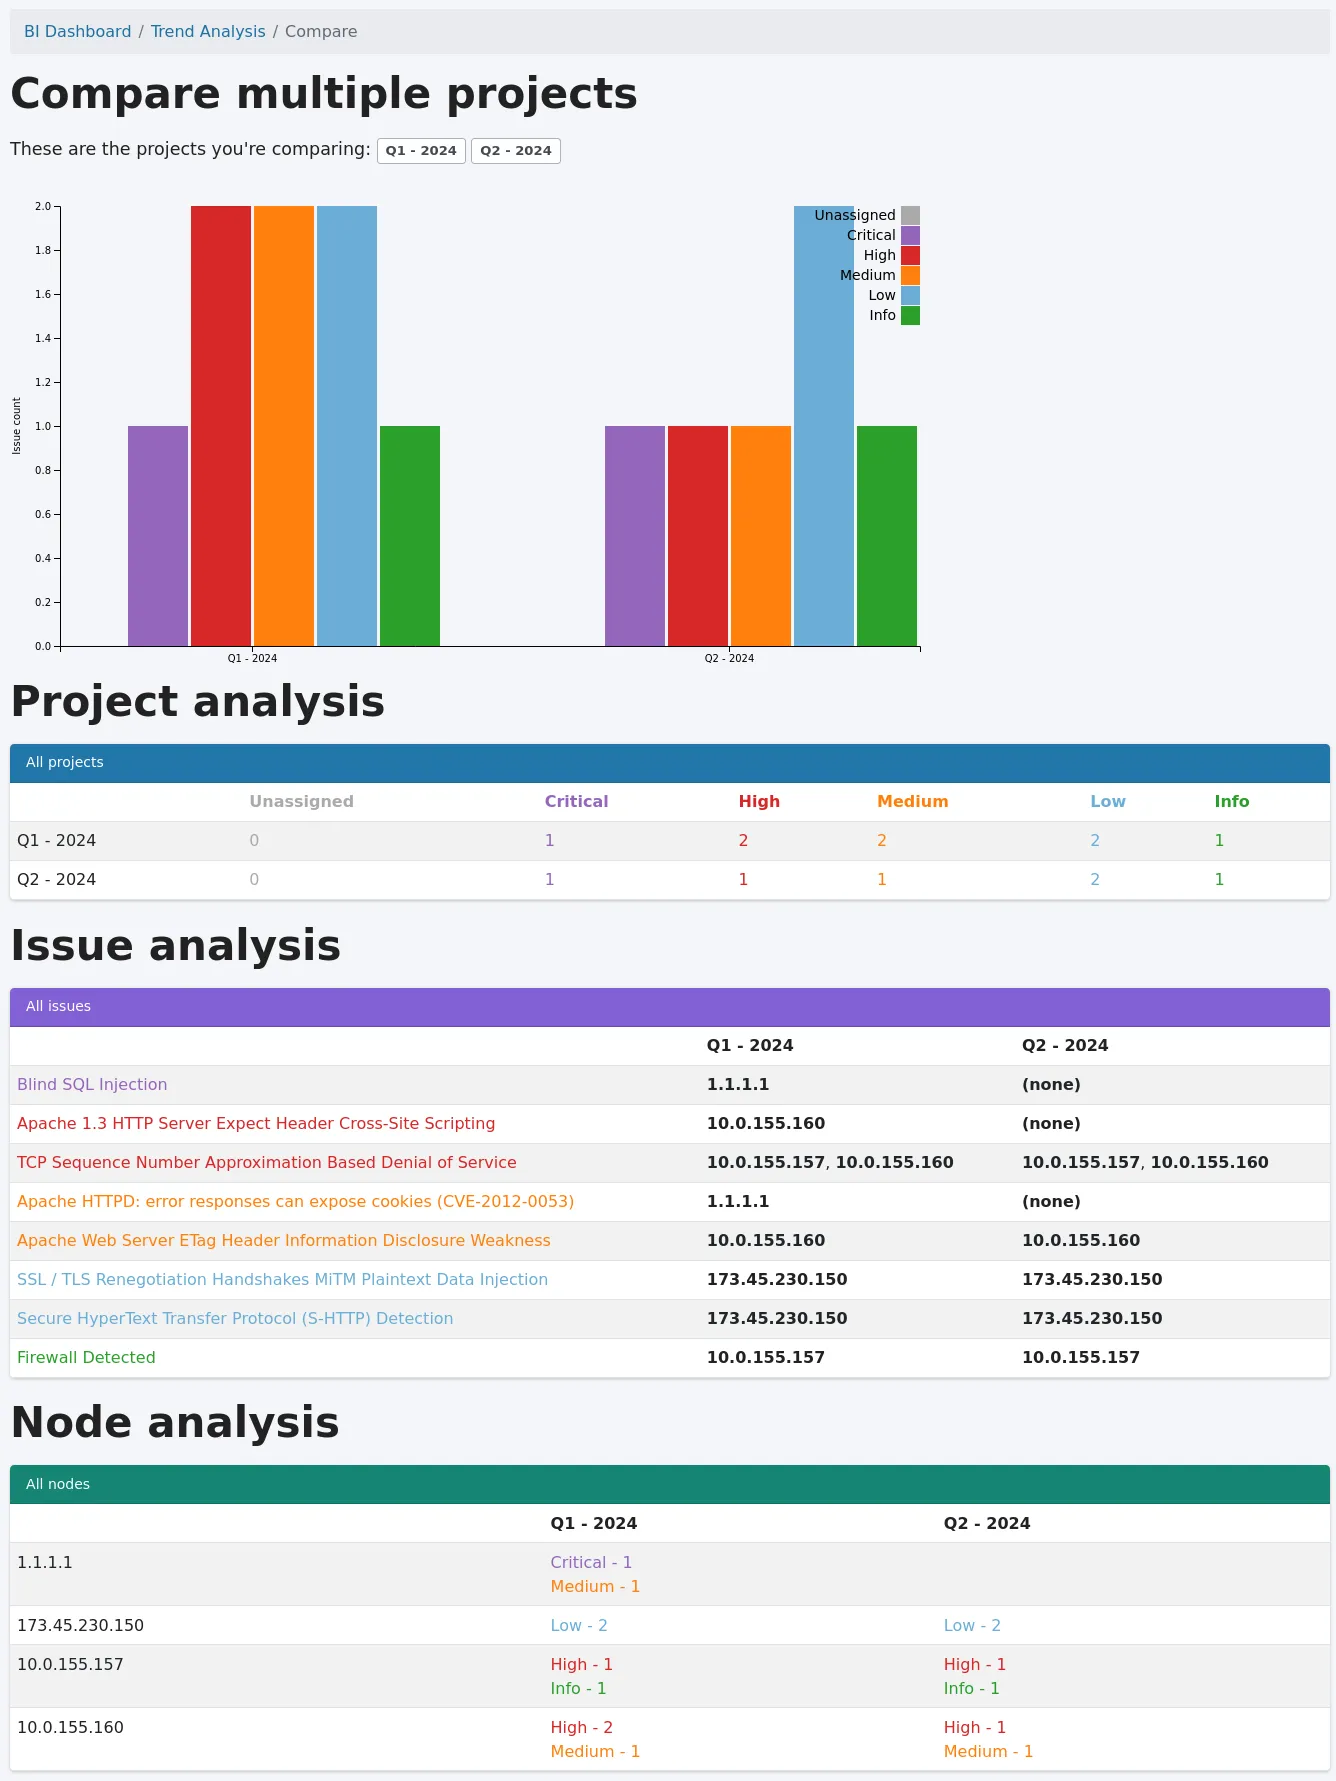
Trend Analysis: Compare and Learn
The Business Intelligence’s Trend Analysis feature lets you select multiple projects and compare them side-by-side to identify patterns and differences.
To use it:
Click “+ Trend analysis” in the sidebar
Select the projects you want to compare (use the filter to narrow your options)
Click “Compare!”
The comparison shows you:
A graph of Issues based on tags across all selected projects
A project analysis table with Issue counts by tag
Issue analysis showing which Issues affect which Nodes in each project
Node analysis displaying Issue counts by tag for each Node
This is invaluable for understanding how similar projects differ, identifying trends over time, or comparing repeat/retest projects.
Answering the Questions That Matter
With the Business Intelligence Dashboard, you can now answer:
What types of projects are you running? Define a “Project Type” property and instantly see the breakdown in your overview charts.
What types of team industries are you serving? Create an “Industry” team property and use Data Analysis to explore the distribution.
Which types of teams are most profitable? Combine revenue properties with industry properties to identify patterns.
What percentage of your projects are under-scoped or over-scoped? Add a “Scope Accuracy” project property and let the Dashboard show you the numbers.
But it doesn’t stop there. The flexibility of custom properties means you can answer questions specific to your business that we never could have anticipated. That’s the beauty of this approach—you’re not limited to our assumptions about what matters. You define what success looks like, and the Dashboard helps you measure it.
What This Means for Your Team
The Business Intelligence Dashboard isn’t just about pretty charts. It’s about making better decisions:
Resource allocation: Understand which project types require more time and adjust your scoping accordingly.
Client focus: Identify which industries or client types align best with your expertise and business goals.
Quality improvement: Track Issue trends across projects to understand where your team excels and where there’s room for improvement.
Business growth: Use data to make informed decisions about which services to expand, which clients to pursue, and how to position your team in the market.
Getting Started
The new and improved Business Intelligence Dashboard is available now in Dradis Pro v4.19.0 and later. If you’re already using Dradis, navigate Tools > Business Intelligence to start defining your custom properties. If you’re new to Dradis, check out our complete documentation to learn more.
We’ve come a long way from that simple Year in Review script. But the journey isn’t over. We’re continuing to enhance the Business Intelligence Dashboard based on your feedback. What insights matter most to your team? What questions are you trying to answer? We’d love to hear from you.
Want to learn more about the Business Intelligence Dashboard? Check out our support guide for step-by-step instructions.
2025 has been a busy and productive year for the entire Dradis team. While we shipped a lot of cool stuff, there are some features that really stand out as we look back over the year. We hope you’ve been making as much use of these as we have.
Our top features and improvements in 2025 include:
Business Intelligence Analytics
Echo: Context-aware Automation for Dradis
Gateway Services and Questionnaires
Whitelabling
Docker Deployments
Hera: Our New Layout
Webhooks
Issue Library CSV imports
Dradis OTP
Project QA
Audit Logging
API Improvements
Read on for a roundup of our favorite features that you may have missed.
We had a lot of requests around a Business Intelligence Dashboard, and now the first version is ready! You can see year-over-year trends of projects, issues, teams, contributors, and custom properties, along with lists of your most common issues across projects.
Improve Issue write-ups, summarize raw scanner output, rewrite tester notes into executive language, enhance remediation advice, and more! With Dradis Echo, you can deploy your preferred LLM locally, with no external connections at all. Your data always stays local to uphold data sovereignty.
This is still in a Beta Release, but if you’d like to test this out or be an early adopter, you can read more about Echo and how to install it.
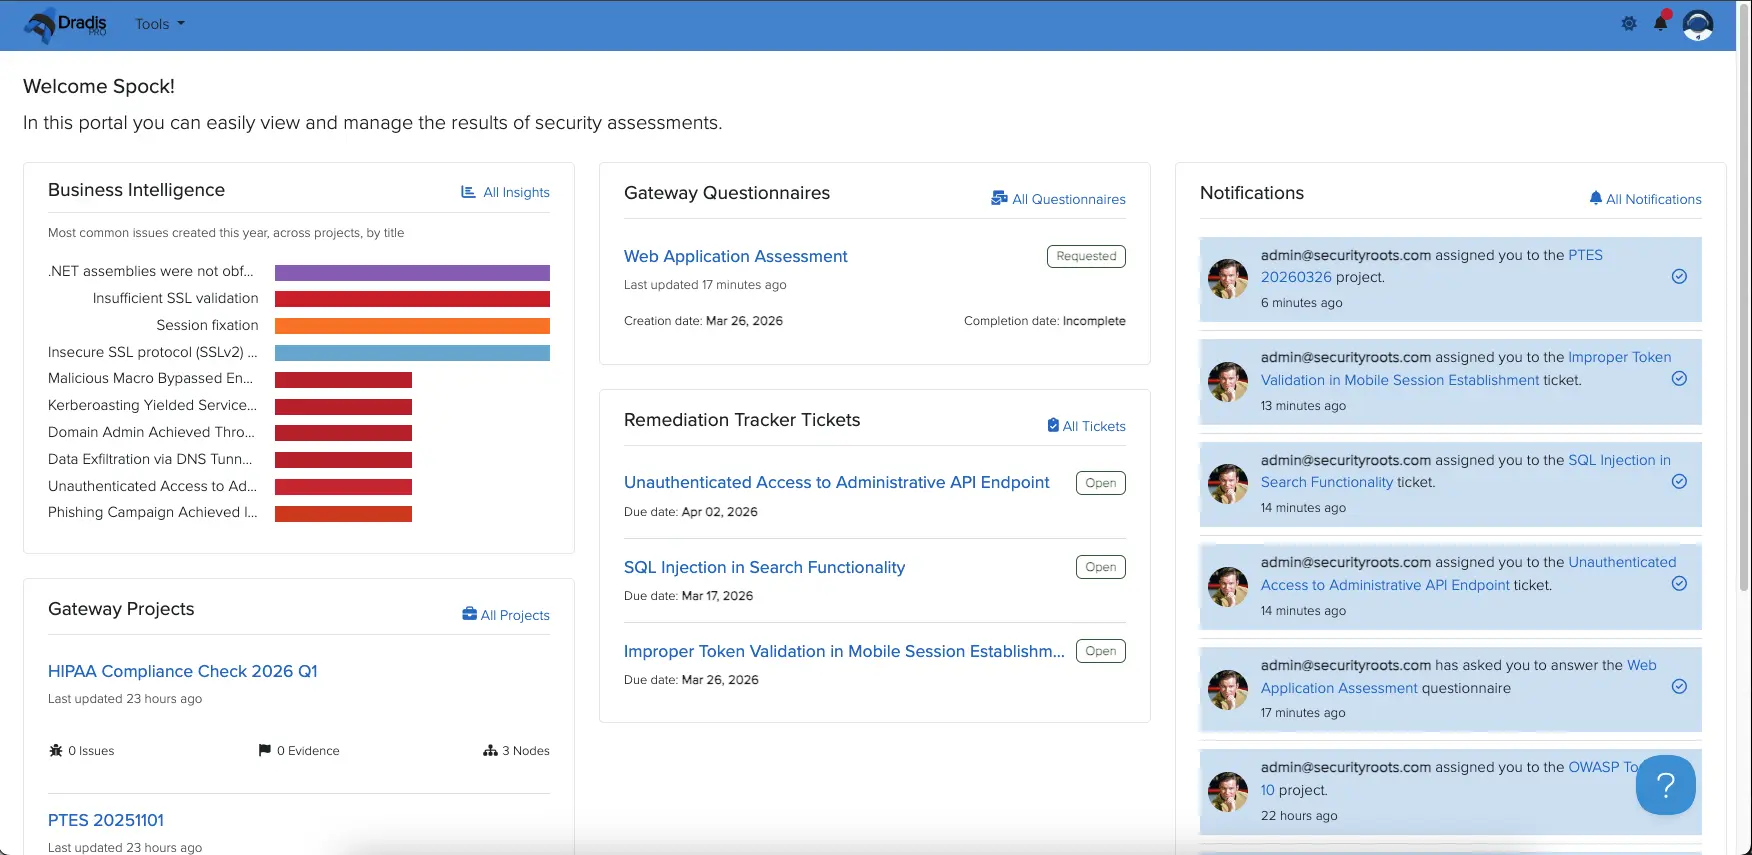
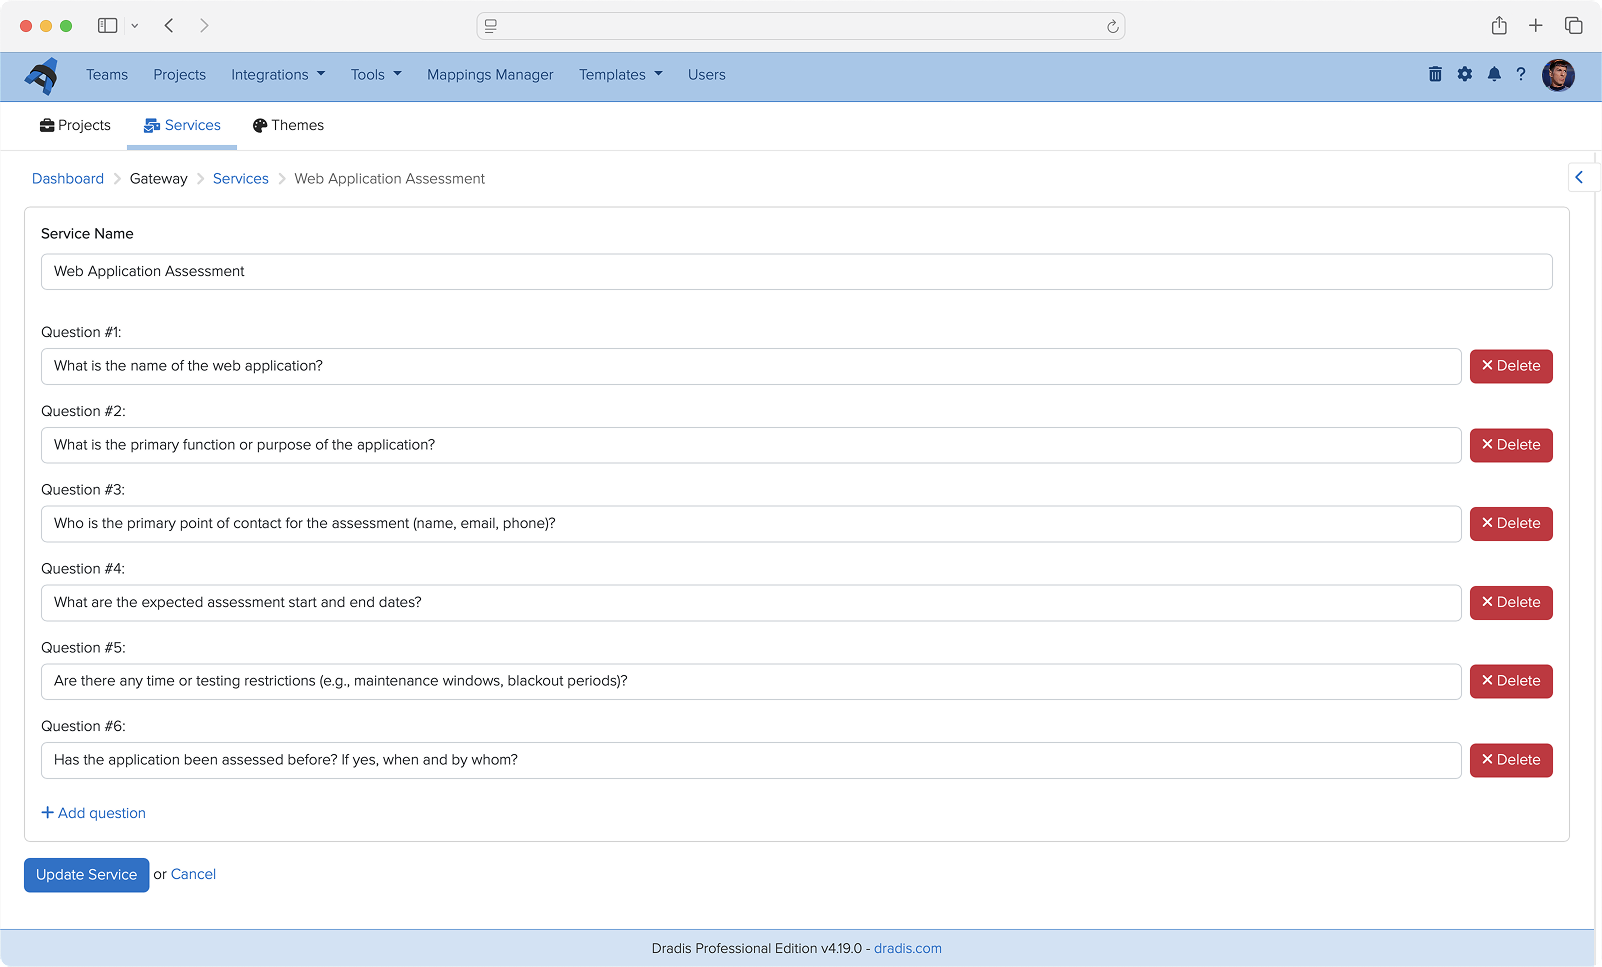
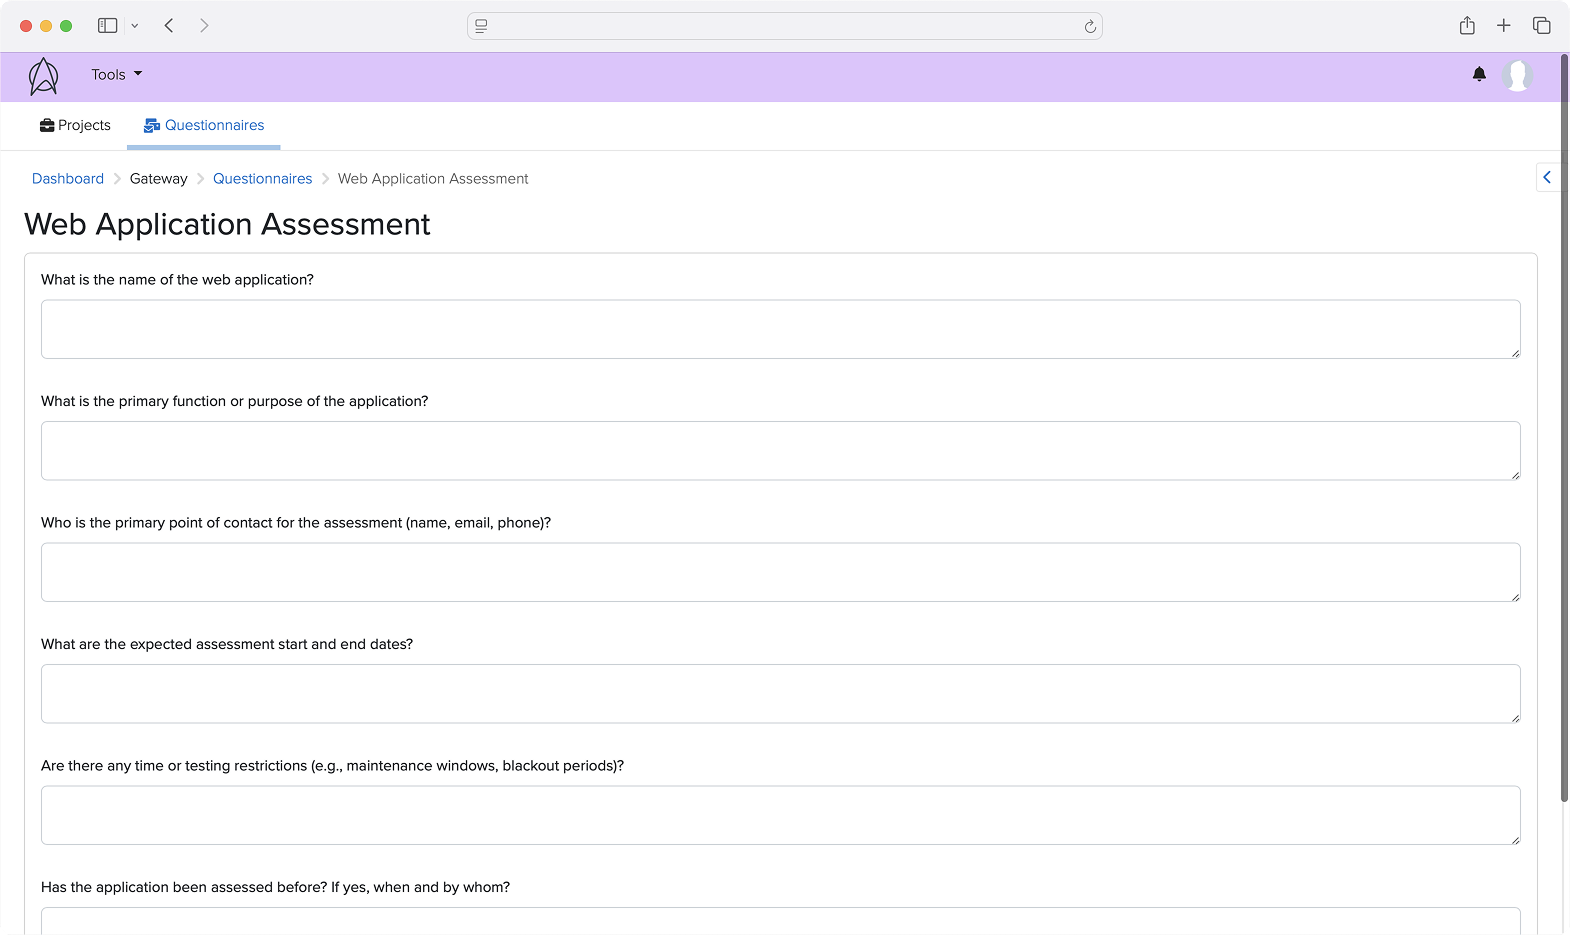
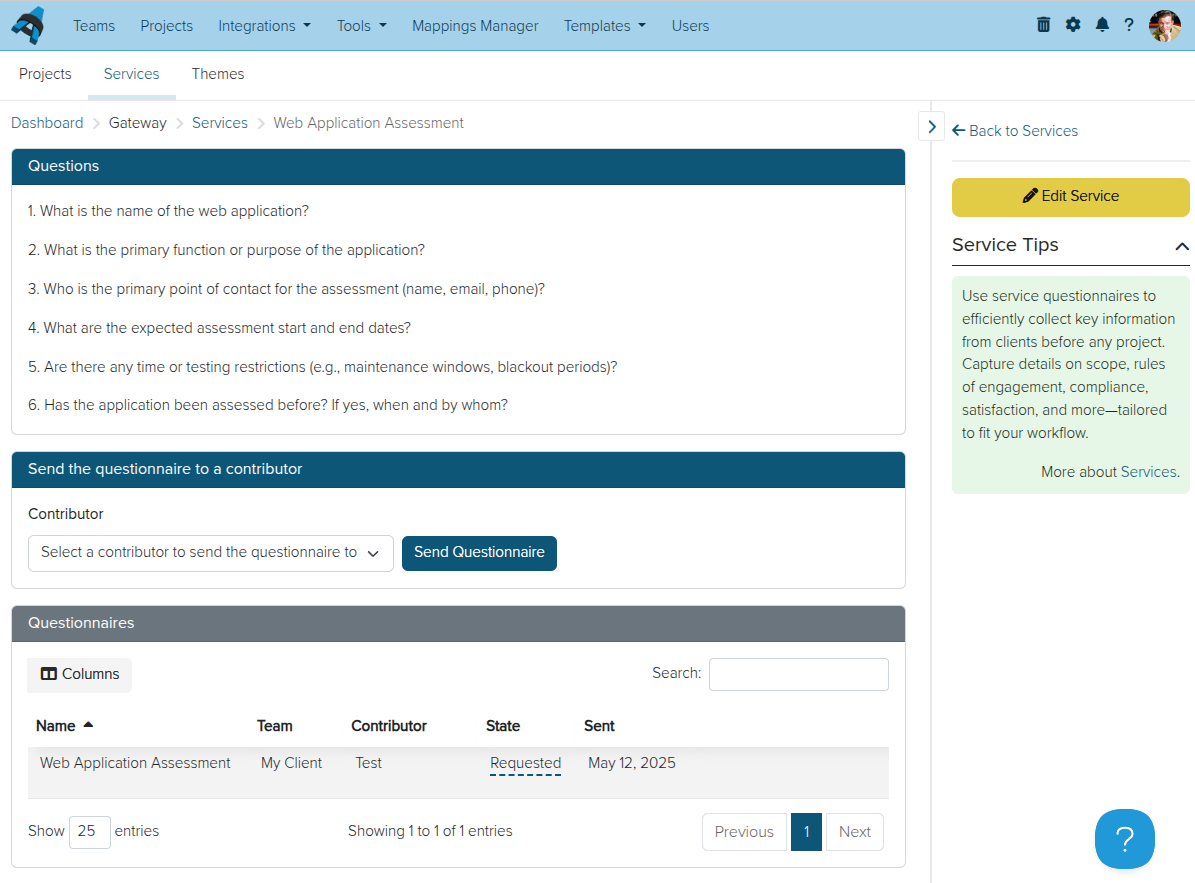
As we continue to improve the features and possibilities of Dradis Gateway, we have built a Services section of the portal where you can create questionnaires to send to Gateway Contributors.
For example, you could use a questionnaire to establish the scope and goals of a penetration test before starting a Dradis project. Based on the responses, you can create a new project for the team right from the questionnaire results.
Teams are also creating post-engagement questionnaires, re-test request questionnaires, and much more!
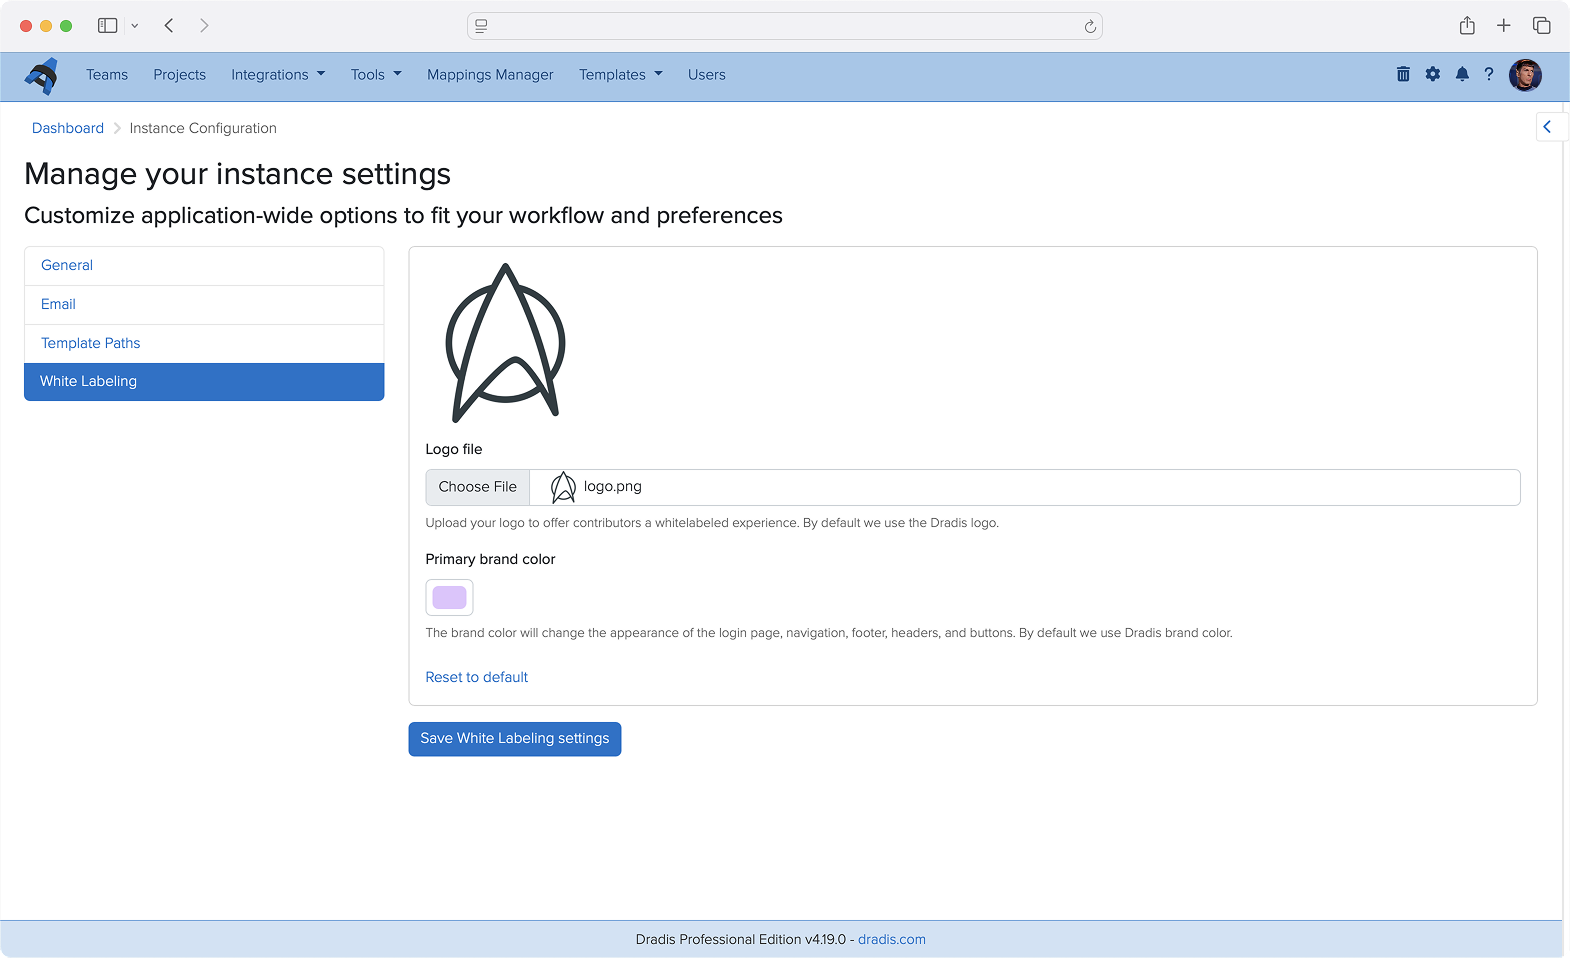
Admins can now add a custom logo and brand color to Dradis. Contributors will see this logo and color when logging in and throughout the Dradis UI, providing a white-labeled experience that reflects your team’s brand identity.
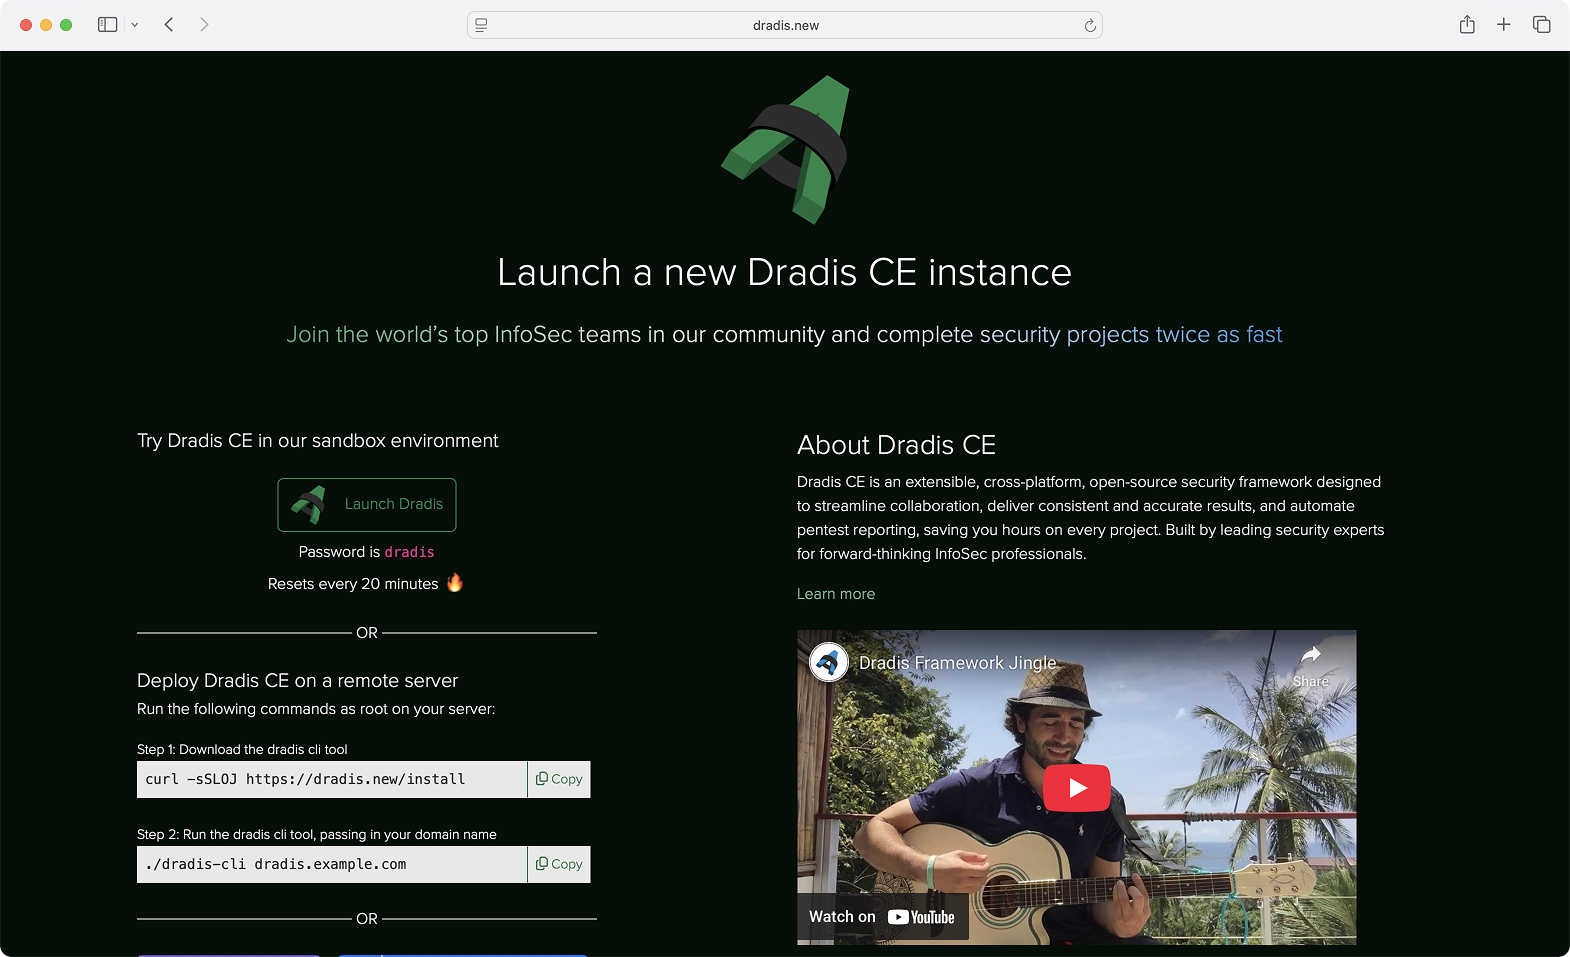
We are now offering new deployment options for Dradis CE (Pro coming soon!). Releases are now available on Docker Hub and we have a new command-line interface that streamlines deployment on a remote server. See https://dradis.new/ for more!
Dradis has been a trusted tool in the pentesting world for over 15 years. Many changes, features, and components have been added during that period, and as the platform evolved, the growing number of links and navigation layers made the layout feel more complex than we’d like. That’s why we’ve decided it’s time for a refresh.
Our main goal was to make Dradis easier to navigate, give it a fresh look, and create a unified layout that feels consistent and intuitive.
The most significant change is the new navigation architecture, introducing a main navigation bar, a secondary navigation bar, as well as a left and right sidebar.
The main nav gives you everything you need to stay on top of your tasks. Projects, tools, settings, and more can be found in the main navigation bar.
The secondary nav has everything you need that is section-related. Whether you’re working on a project or using a tool, you can find all the related links here. Available as needed.
The left sidebar is available in projects and is dedicated to Nodes, allowing you to easily navigate through them, while the right sidebar contains secondary content that you may need to get the job done.
If you’re wondering about the name, Hera Agathon is a character in the Battlestar Galactica universe. She was the first human-Cylon hybrid to exist, also known as “the shape of things to come” before her birth. Hera symbolizes a new era, the future, a way of moving forward, making it the perfect name for Dradis’ new updated layout!
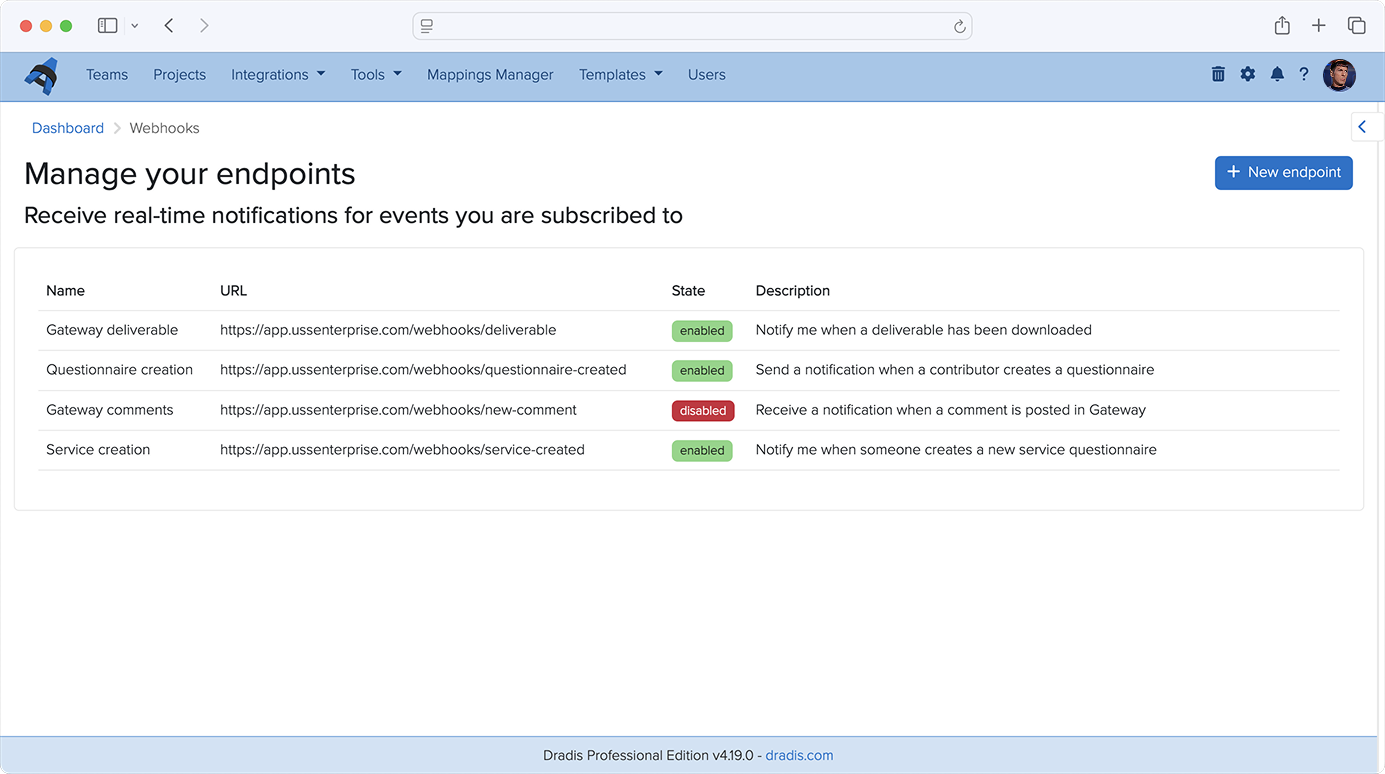
You can now use Webhooks to carry out actions based on events in Gateway. Contributor requests, remediation progress, and project completions can trigger automated actions across your security stack. For example, kick off an onboarding flow when a client submits a project request through Gateway, post Slack updates on new events in Gateway projects, or sync your ticket status across Jira, Azure DevOps, or ServiceNow.
While only Gateway webhooks are supported today, we plan to support other types of events in the very near future!
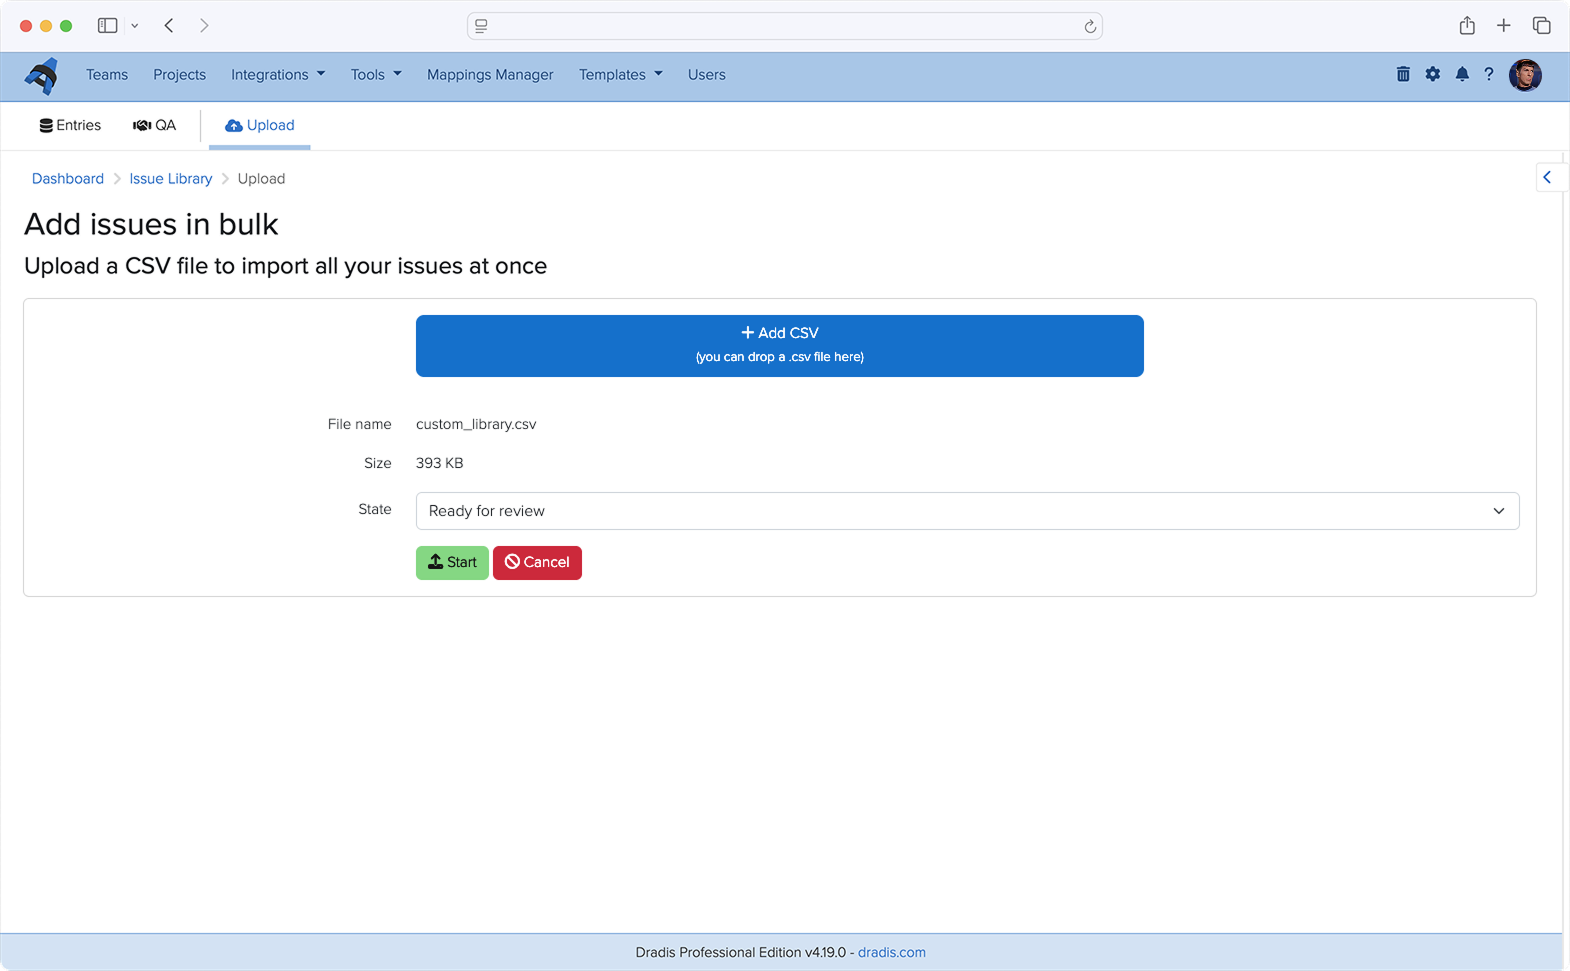
Have an existing library of Issues that you’d like to use in Dradis? You can now upload CSV files to the Issue Library to bulk-import your own set of custom issues. No more tedious copy/pasting or re-formatting. Our support team is still available to help with more complex imports with our concierge service.
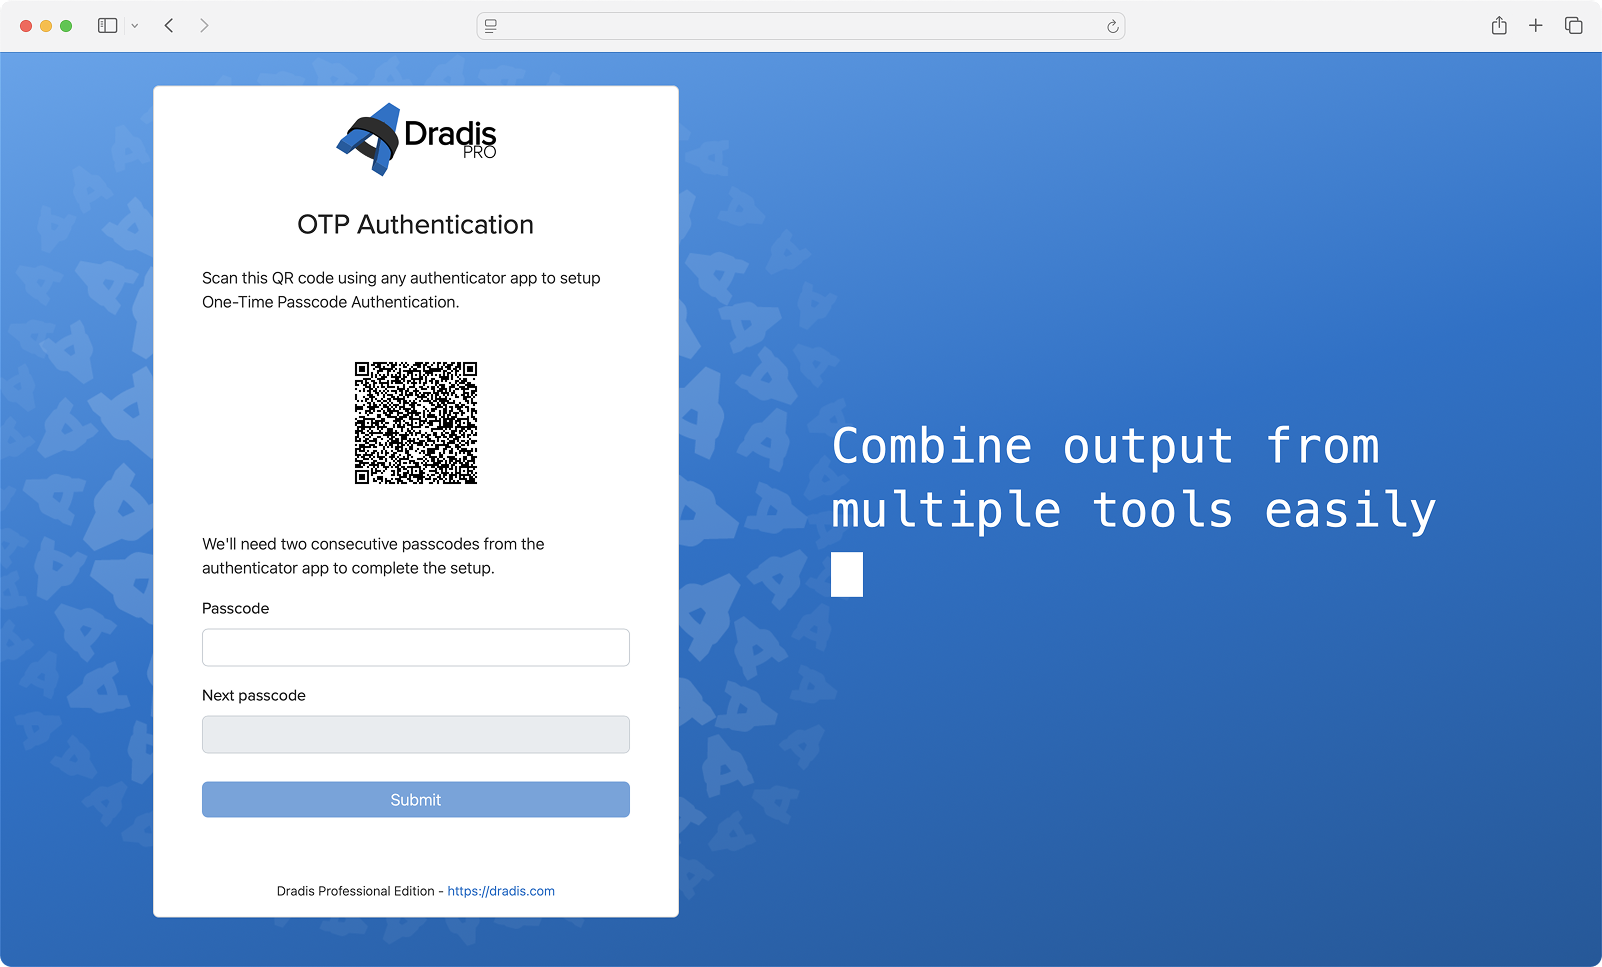
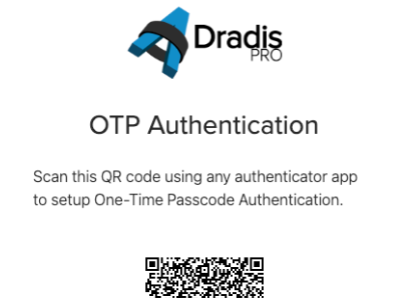
We have created our own multi-factor authentication integration, Dradis OTP. You are no longer limited to using DuoWeb for MFA. With Dradis OTP, you can create and scan a QR code to use for MFA in whichever authenticator app you use.
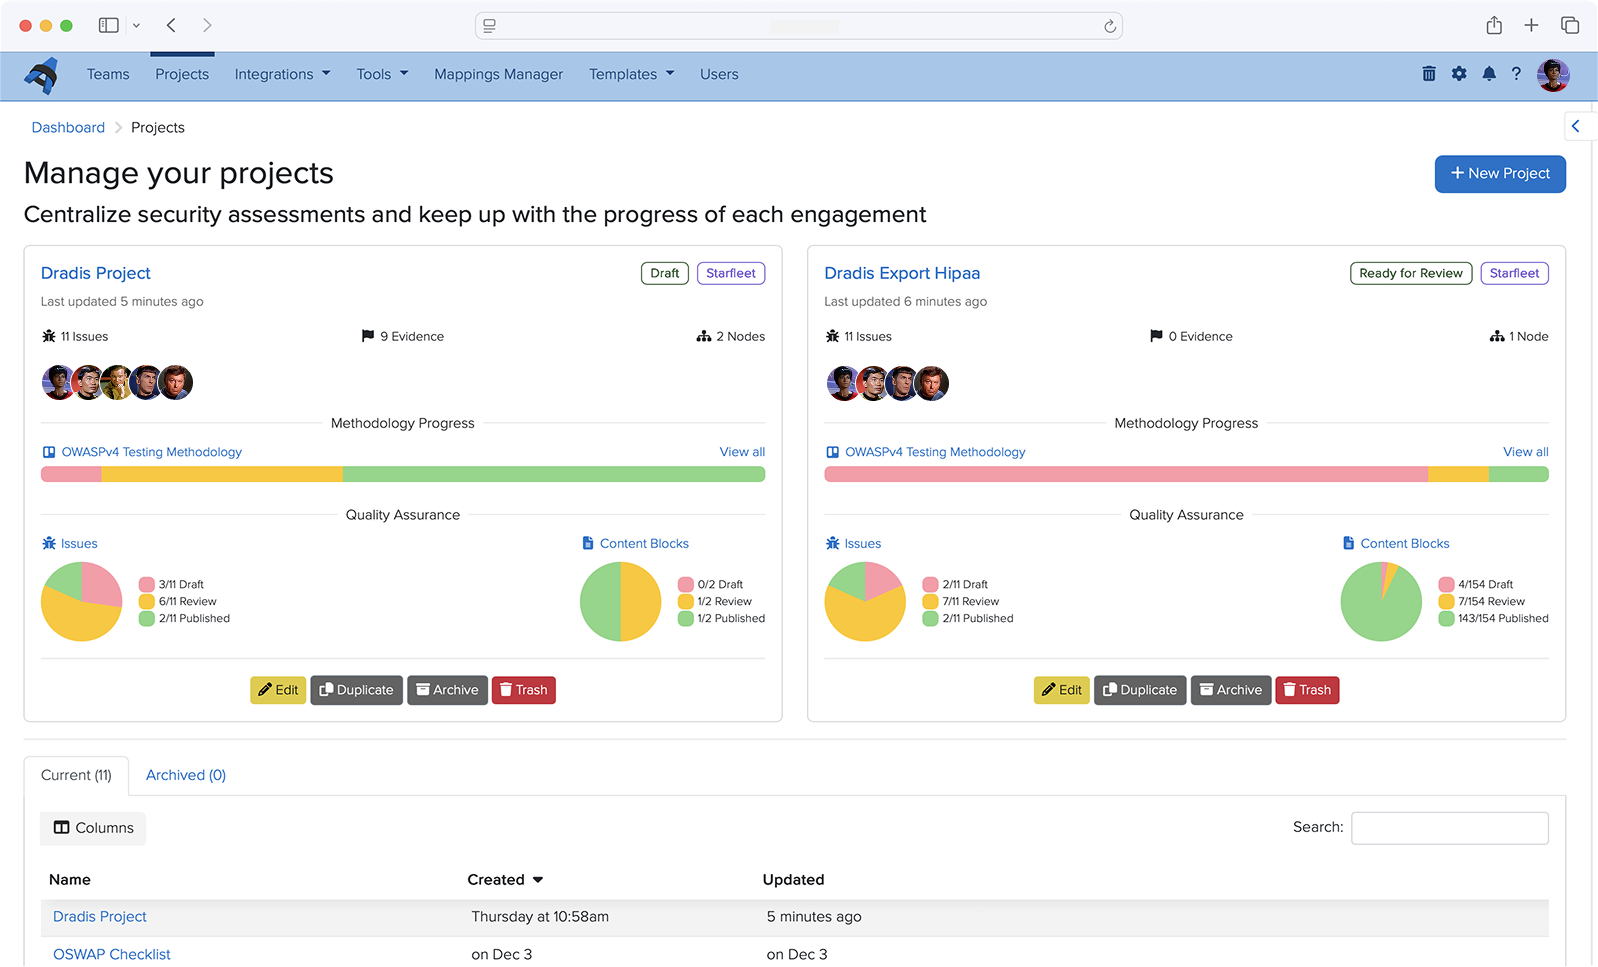
Many teams love our in-project QA flow for Issues and Content Block, and it’s sparked a good amount of feedback to bring something like this to the project level. Teams want to know which projects are ready for review without opening each project and going to the QA views.
Projects now have overall States that can be customized in BI to fit your team’s unique workflow requirements. The Project State is actually a custom project propery in BI which enables getting project insights by state.
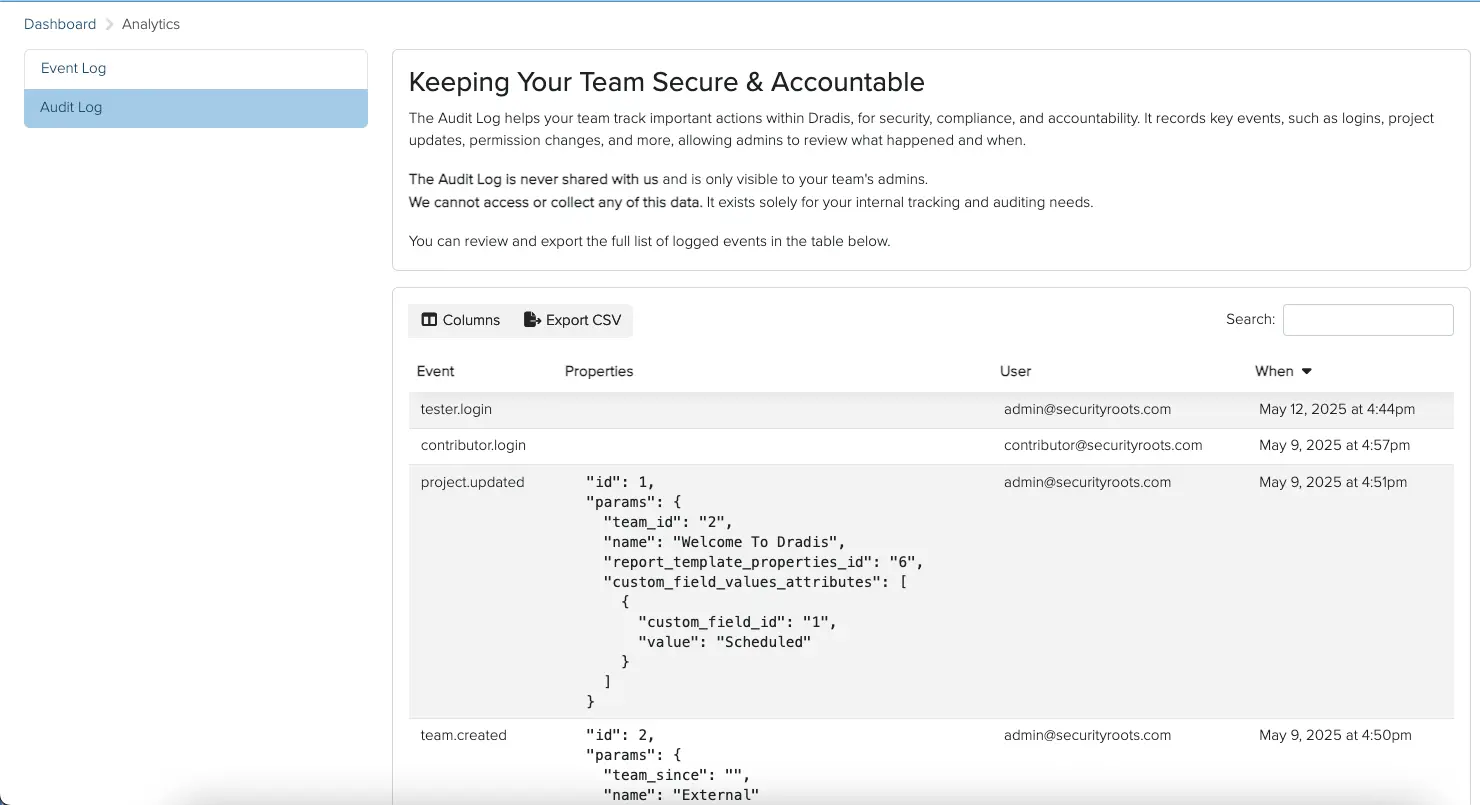
By popular request, we have added audit logging to Dradis, which tracks activity on a deeper level than the Recent Activity tabs and gathers it in one place. Your logs for the whole Dradis instance are now easily accessible for your security, compliance, and accountability needs. You can even export them to CSV files!
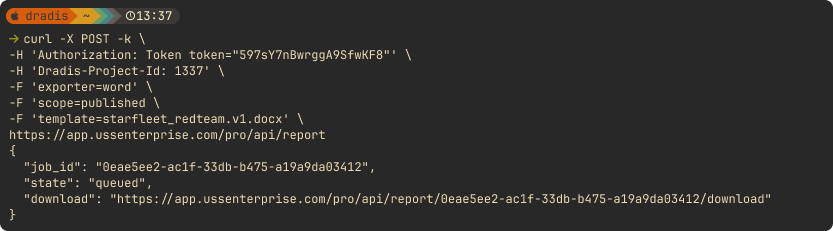
We added a number of API improvements throughout the year, such as adding an endpoint for exporting and downloading reports, as well as adding Node Properties to the Node endpoint. Save time and boost efficiency with the Dradis API, designed to automate repetitive tasks and fit perfectly into your unique workflow.
Looking Ahead
2025 has been a transformative year for Dradis. From the powerful insights unlocked by our Business Intelligence analytics to the intelligence-driven capabilities of Echo, we’ve focused on building features that don’t just add functionality but fundamentally improve how security teams work. Gateway has opened entirely new collaboration possibilities, bringing your clients directly into the platform and streamlining communication in ways that weren’t possible before.
And we’re not slowing down! Our 2026 drawing board is already packed with innovations that will push Dradis even further. We’re excited about what’s coming, and we can’t wait to share it with you as these features take shape.
Thank you for being part of the Dradis community. Your feedback, feature requests, and real-world use cases continue to drive our development priorities. Here’s to an even more productive 2026. 🚀
Now AI integration is available (and entirely optional!) for Dradis. With Dradis Echo, you can deploy your preferred LLM in Ollama – a framework that lets you run LLMs locally, no external connections at all necessary – to work with Dradis. Use it to summarize raw scanner output, rewrite tester notes into executive language, enhance remediation advice, and more!
Webhooks for Dradis Gateway
You can now use Webhooks to carry out actions based on events in Gateway. Contributor requests, remediation progress, and project completions can trigger automated actions across your security stack. For example, kick off an onboarding flow when a client submits a project through Gateway, post Slack updates on new events in Gateway projects, or sync your ticket status across Jira, Azure DevOps, or ServiceNow.
While only Gateway webhooks are supported in Dradis v4.19, we plan to support other types of events in the future!
IssueLibrary improvements
We have also launched a series of improvements to the IssueLibrary. You can now upload CSV files to the IssueLibrary to bulk-import your own set of custom issues. You can bulk-delete issues in the IssueLibrary view. And finally, now when you go to add an IssueLibrary entry to a project, you can see each entry’s QA status, so you don’t import an unreviewed work-in-progress by accident!
Release Notes
Editor:
Add inline code and highlight code buttons to the toolbar
Layout:
Improve primary action visibility for Evidence, Issues, Methodologies, Notes, and Node Properties
Navigation:
Move Trash and Project Configurations in main navigation bar
Contributors:
Add a dashboard with Gateway, Remediation Tracker, and Notification widgets
Hera:
Improve primary action visibility and add view description
Projects:
Add user select-all functionality in project creation
Webhooks:
Add event-driven webhook implementation
Upgraded gems:
faraday, rack, rails, uri
Bugs fixes:
Editor:
Add disabled button styling
Datatables:
Ensure correct record ordering when applying sorting
Kits:
Restore the functionality of the ‘Add mappings from kit’ option
Notifications:
Remove the duplicate breadcrumb link shown in project notifications
Sidebar:
Prevent the toggle button from being covered by the scrollbar
New integrations:
Webhooks:
react to server-side events in your other systems
Integration enhancements:
Gateway:
Add activities tracking
Add event instrumentation for webhooks
Issue Library:
Add bulk delete action for entries
Import entries to the library using a CSV file
Import published entries to projects when using QA
We get many feature requests about the Business Intelligence Dashboard, and now the first batch is ready! You can now see year-over-year trends of activities and custom properties, and lists of your most common issues across projects. Get a clearer look at changes over time at a glance.
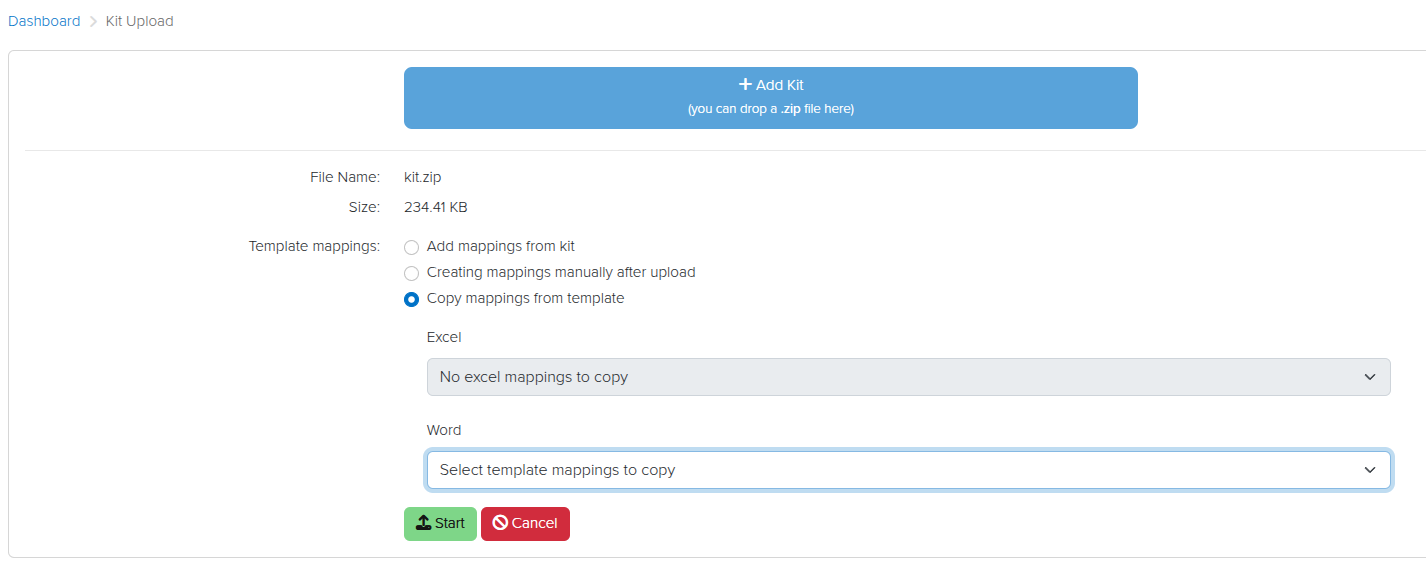
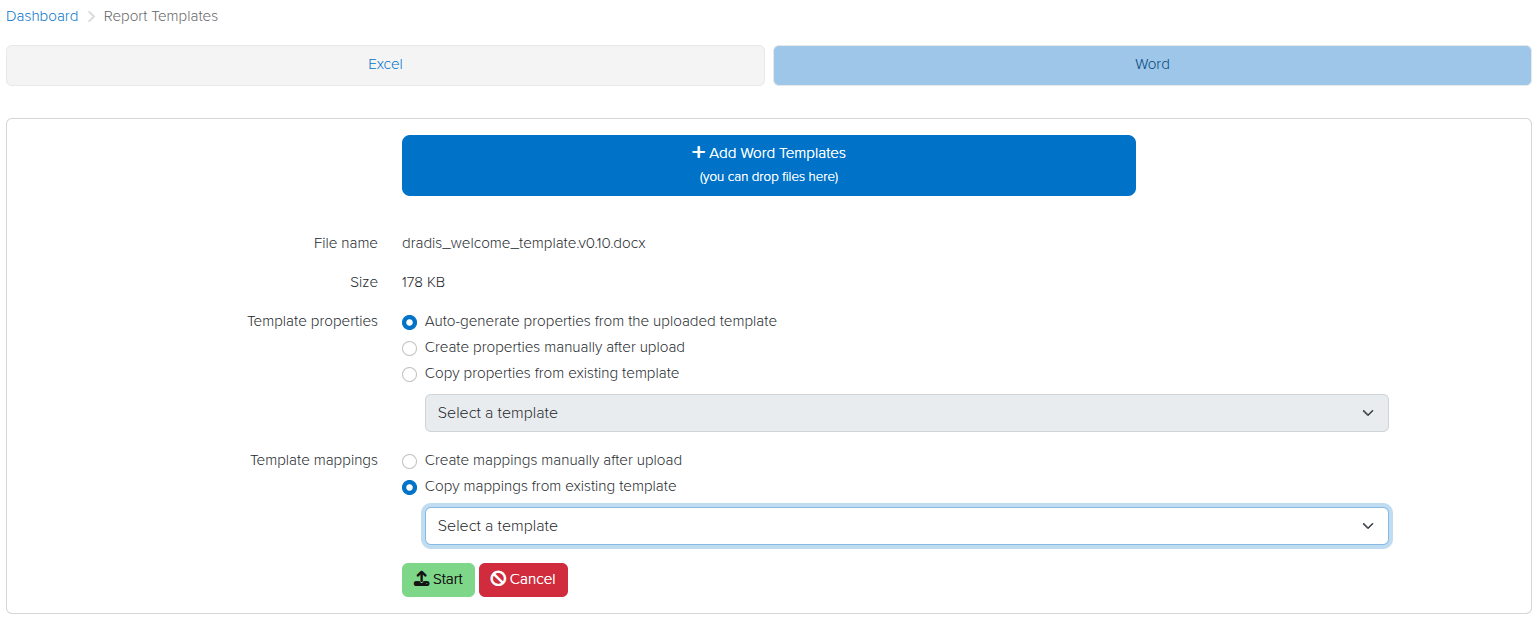
The Mappings Manager lets you keep multiple different mappings for different templates across tools. Now we have also made it easier to copy existing template mappings to new or updated templates when you upload them. When you upload a new Kit, you can select the mappings to apply or copy:
Copy existing mappings to new templates
When you upload a new template (e.g., when you have updated a template and you want to move to the newer version), you can choose to copy existing mappings or to create new ones:
This will get you up and running with updated templates quickly and easily!
Release Notes
Activities:
Include methodology name in all methodology actions
Business Intelligence:
Add Custom Properties view
Add Dashboard view with Year-Over-Year insights
Add sub-navigation
Font:
Improve font weight consistency for international characters
Layout:
Add custom error pages
Issuelib:
Update entry edit UI to match issue edit UI
Mappings:
Add an option to copy existing mappings when uploading kits or report templates
Rails:
Upgrade Rails version to 8.0.2.1
Ruby:
Upgrade Ruby version to 3.4.4
Upgraded gems:
resque, rexml, selenium-webdriver, thor
Bug fixes:
Combobox:
Prevent forcing the selection of the first available option for multi-select forms
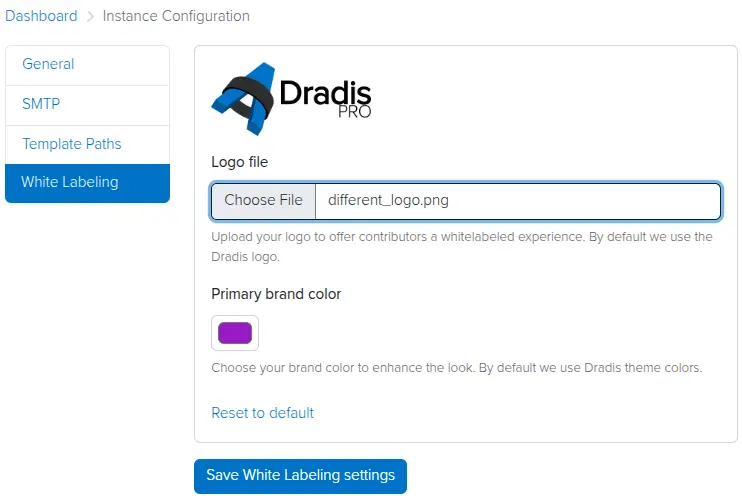
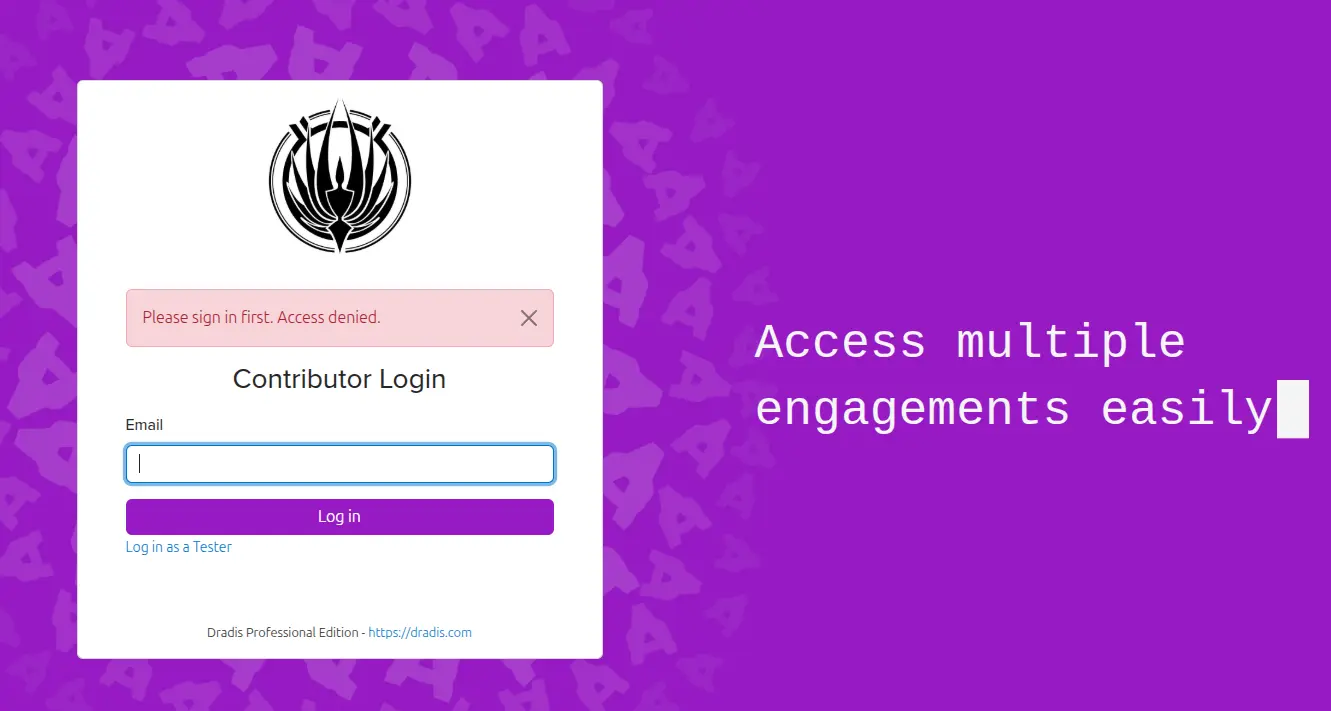
Admin testers can now add a custom logo and brand color in the Instance Settings view. Contributors will see this logo and color in the Dradis UI, providing a white-labeled experience that reflects your brand identity.
Simply click on the cogwheel to the top right, click Instance Configuration, then White Labeling, and set your preferred logo and brand colour.
Now your Contributor Login page will be branded with your logo and colour scheme.
MITRE ATT&CK calculator
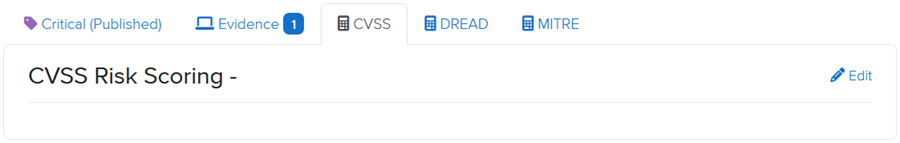
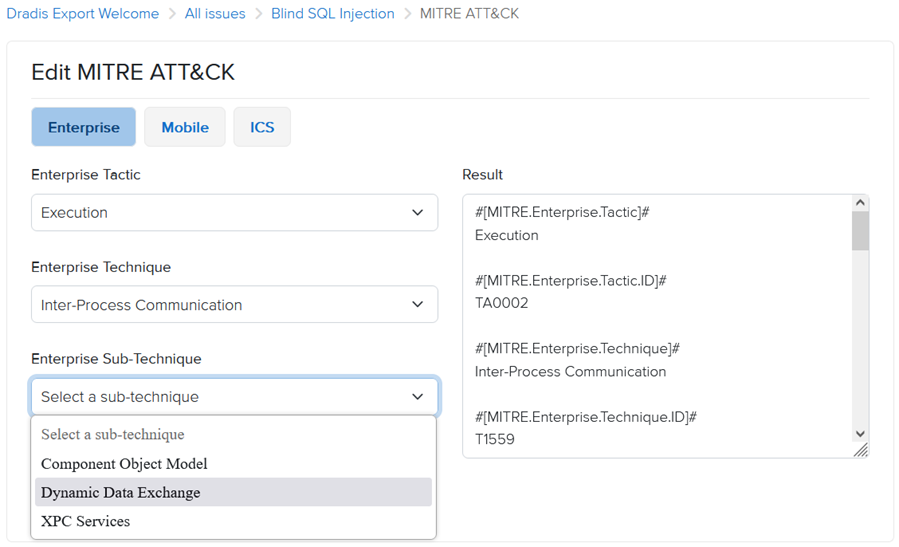
We have added a new MITRE ATT&CK calculator, based on the MITRE ATT&CK matrices for Enterprise, Mobile, and ICS (more details: https://attack.mitre.org/). You can now add MITRE ATT&CK metrics to Issues from the MITRE tab.
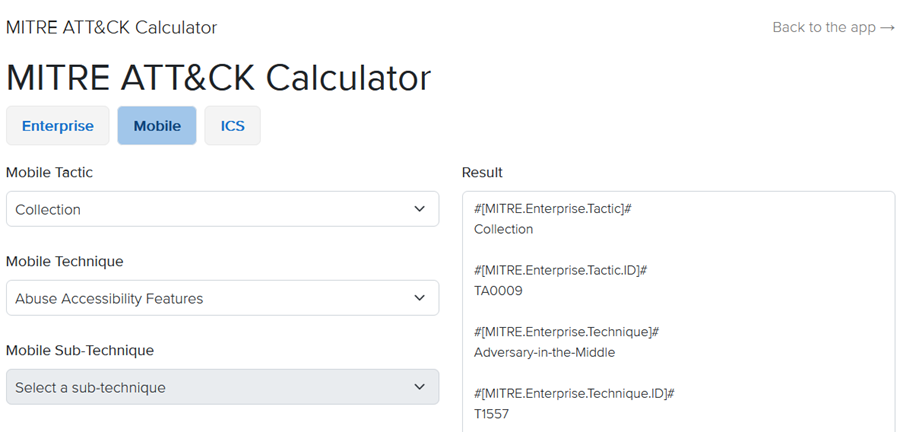
Once you select a Tactic, the calculator will load the associated list of Techniques, followed by Sub-Techniques based on your selection. You can include Enterprise, Mobile, and ICS data all within the same Issue.
Additionally, the calculator is available as a standalone tool from the Tools menu in the top navigation bar.
Kit downloads
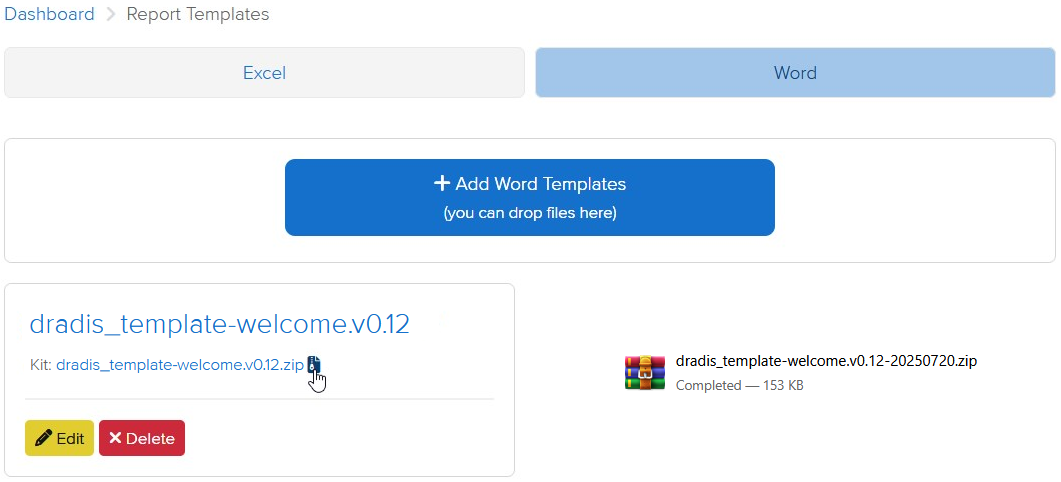
Report templates can now be downloaded as a Kit, including report template properties and mappings. This makes it easier to share and reuse report templates while maintaining all of the associated context.
Release Notes
Activation:
Add offline activation option for when online activation fails
Active project cards:
Display the most recently updated Methodology
Render empty states instead of hiding content
Admin settings:
Add ability to white label contributor-facing views
Update UI to match other settings-related UIs
Analyzer:
Add support for multi-word fields
Calculators:
Add MITRE ATT&CK
Contributors:
Use Contributor login by default
Hera:
Update brand colors
Add sub-navigation icons to improve consistency
Jobs:
Add /jobs view to view and manage background jobs
Logs:
Update logs to use string UIDs
Mailer:
Fix email footer incorrectly redirecting to tester login
Profile:
Add click-to-reveal functionality for the API token
Report Templates:
Add option to download a kit for each report template
Upgraded gems:
nokogiri
Bugs fixes:
Avatars:
Fix avatars disappearing after enabling/disabling an integration
Calculators:
Render Calculator links in tools menu
Quote Selector:
Scroll to comment box in Safari after selecting quote content
Word:
Only process scoped issues in node content controls
Don’t create an analytics event when validating the project
Integration enhancements:
Gateway:
Add dynamic project title to Ares theme
Issue Library:
Update issues import to be more consistent with the table search
LDAP:
Enable installation and editable configuration through the Tool Manager
Nessus:
Ignore entries that have blank values
SAML:
Add name_identifier_format in the config generator and default to ’emailAddress’ instead of ‘unspecified’
Reporting enhancements:
Adjust the default styles for unordered bulleted lists
Excel:
Track failed job states using JobTracker
Filters:
Fix filters with double quotes (“) not catching the correct values
Word:
Track failed job states using JobTracker
REST/JSON API enhancements:
Export: Add endpoints for exporting and downloading Word/Excel reports
Our designers have been working to completely overhaul the application interface to be more modern and integrated. Both the main interface and the individual projects view now use the same visual style, and you have access to all the application’s sections from the project view, so now you can go straight to your mappings or IssueLibrary from your project, rather than having to go through the Dashboard first.
Gateway Services and Questionnaires
As we continue to improve the features and possibilities of the Dradis Gateway, we have now created a new Services section of the portal. Here you can create questionnaires, which you can then send to Gateway Contributors. For example, you could use a questionnaire to establish the scope and goals of a penetration test before starting a Dradis project for them. On the basis of their responses, you can create a new project for their team right from the questionnaire results.
MFA with one-time passcodes
We have now created our own multi-factor authentication integration, Dradis OTP. You are no longer limited to using DuoWeb for free MFA in Dradis. With Dradis OTP, you can create and scan a QR code to use for MFA in whichever MFA app you prefer.
Audit logging
By popular request, we have created the Dradis Audit integration, which tracks activity in Dradis on a deeper level than the Recent Activity tabs and gathers it in one place. Your logs for the whole Dradis instance are now easily accessible for your security, compliance, and accountability needs.
Release Notes
Contributors:
Add an intermediate login page to prevent Microsoft Safe Links from consuming the one-time token
Add Notification Settings link
Forms: Add a combobox for selecting, filtering, and creating options
Hera: Add new layout with redesigned navigation
Navigation: Replace Turbolinks with Hotwire
QA:
Add project states and QA stats in the active projects card
Add View History link when viewing Issues/Content blocks
Add a ‘Reviewer’ role for publishing Issues/Content blocks
Automatically go to the next record after reviewing
Revisions: Show state changes in the revisions view
Usage Tracking: Track the choice of toggling on/off