Custom charts and graphs
This guide contains:
Create the chart
Start out with the finished product! Add a placeholder chart to your report template.
-
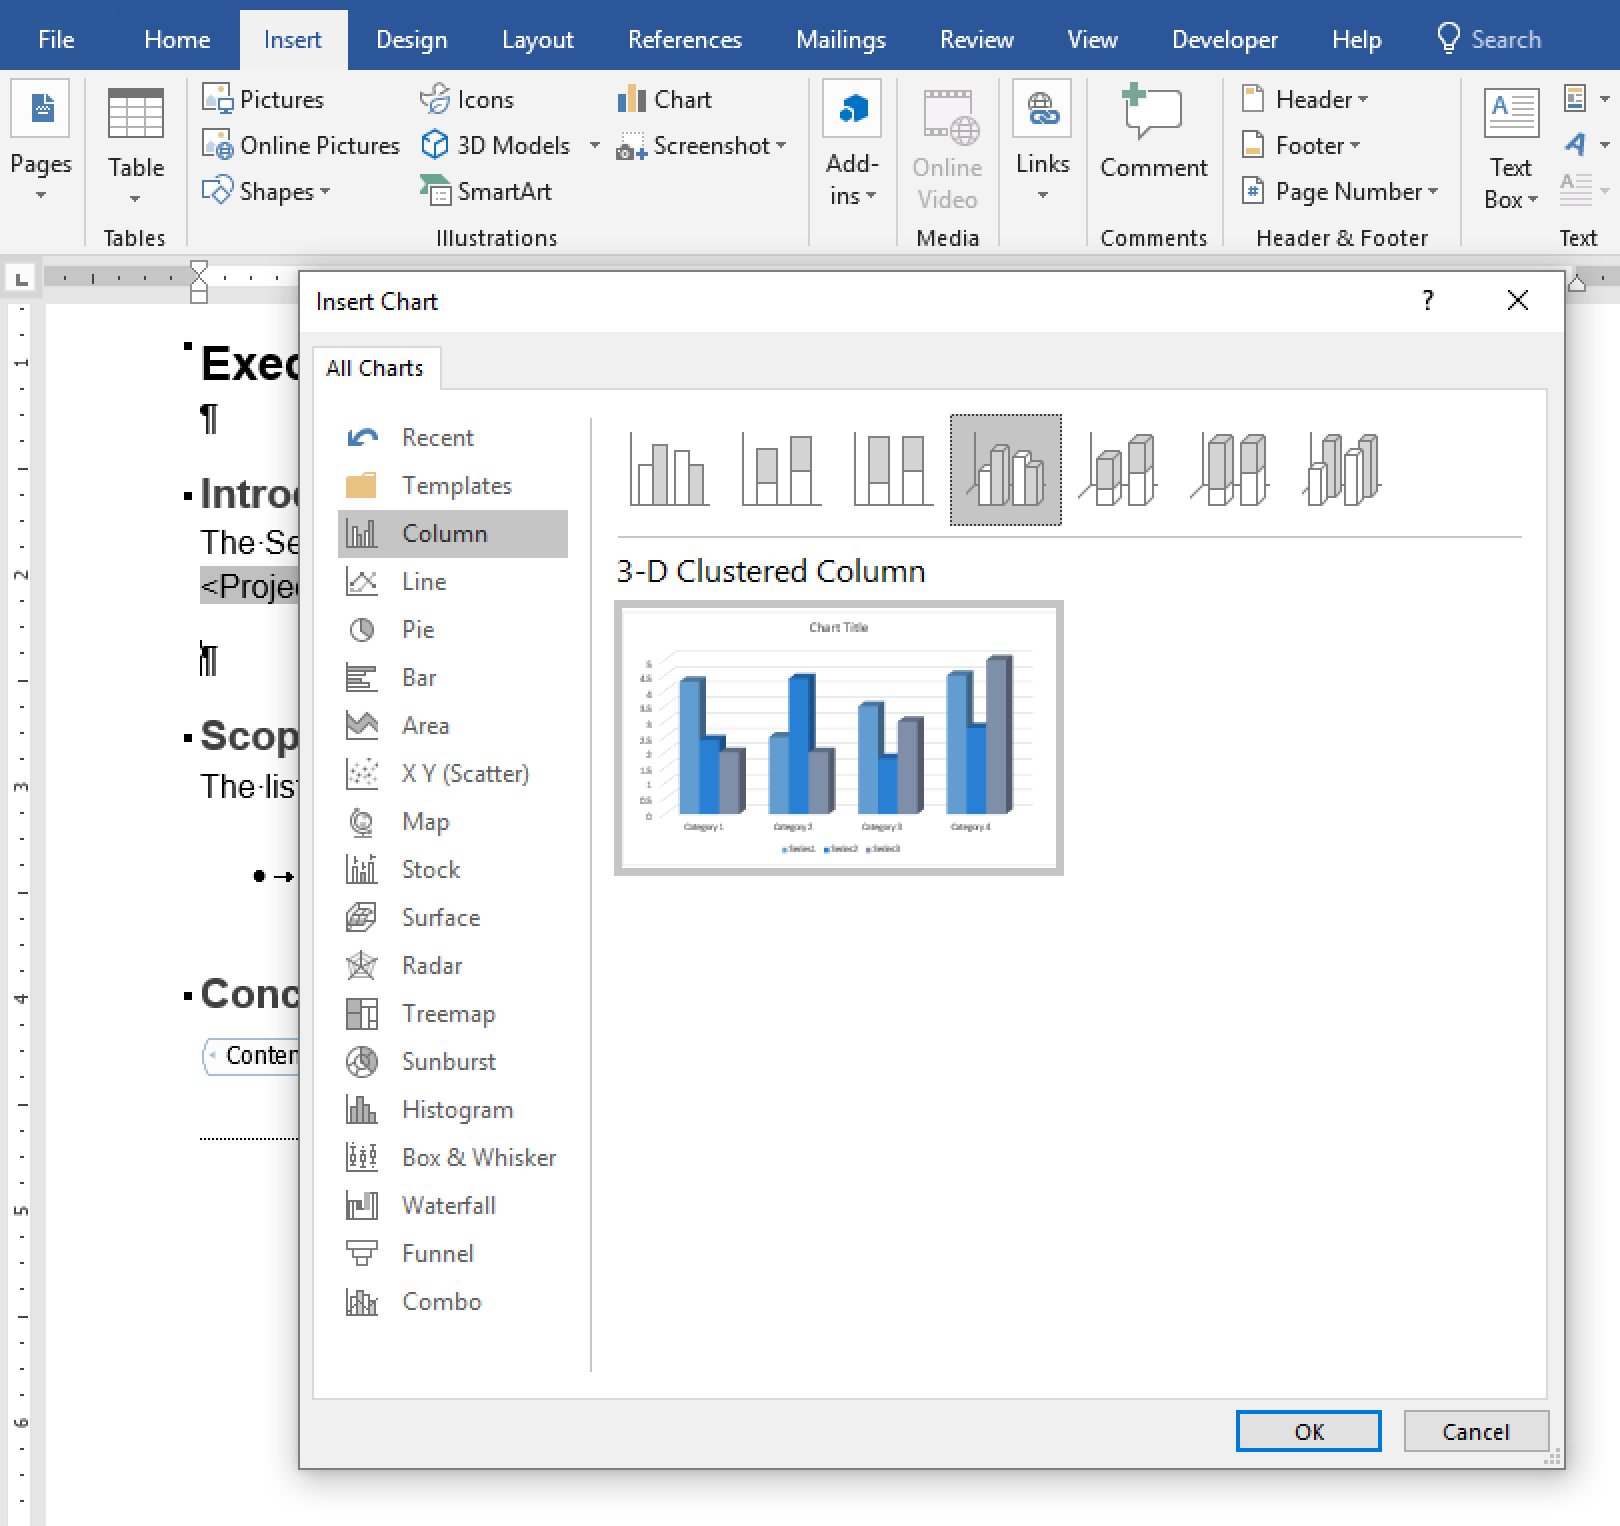
In Word, navigate to the Insert tab, then click Chart and select the type of chart (bar, column, pie, etc) that you want to add to your reports:
-
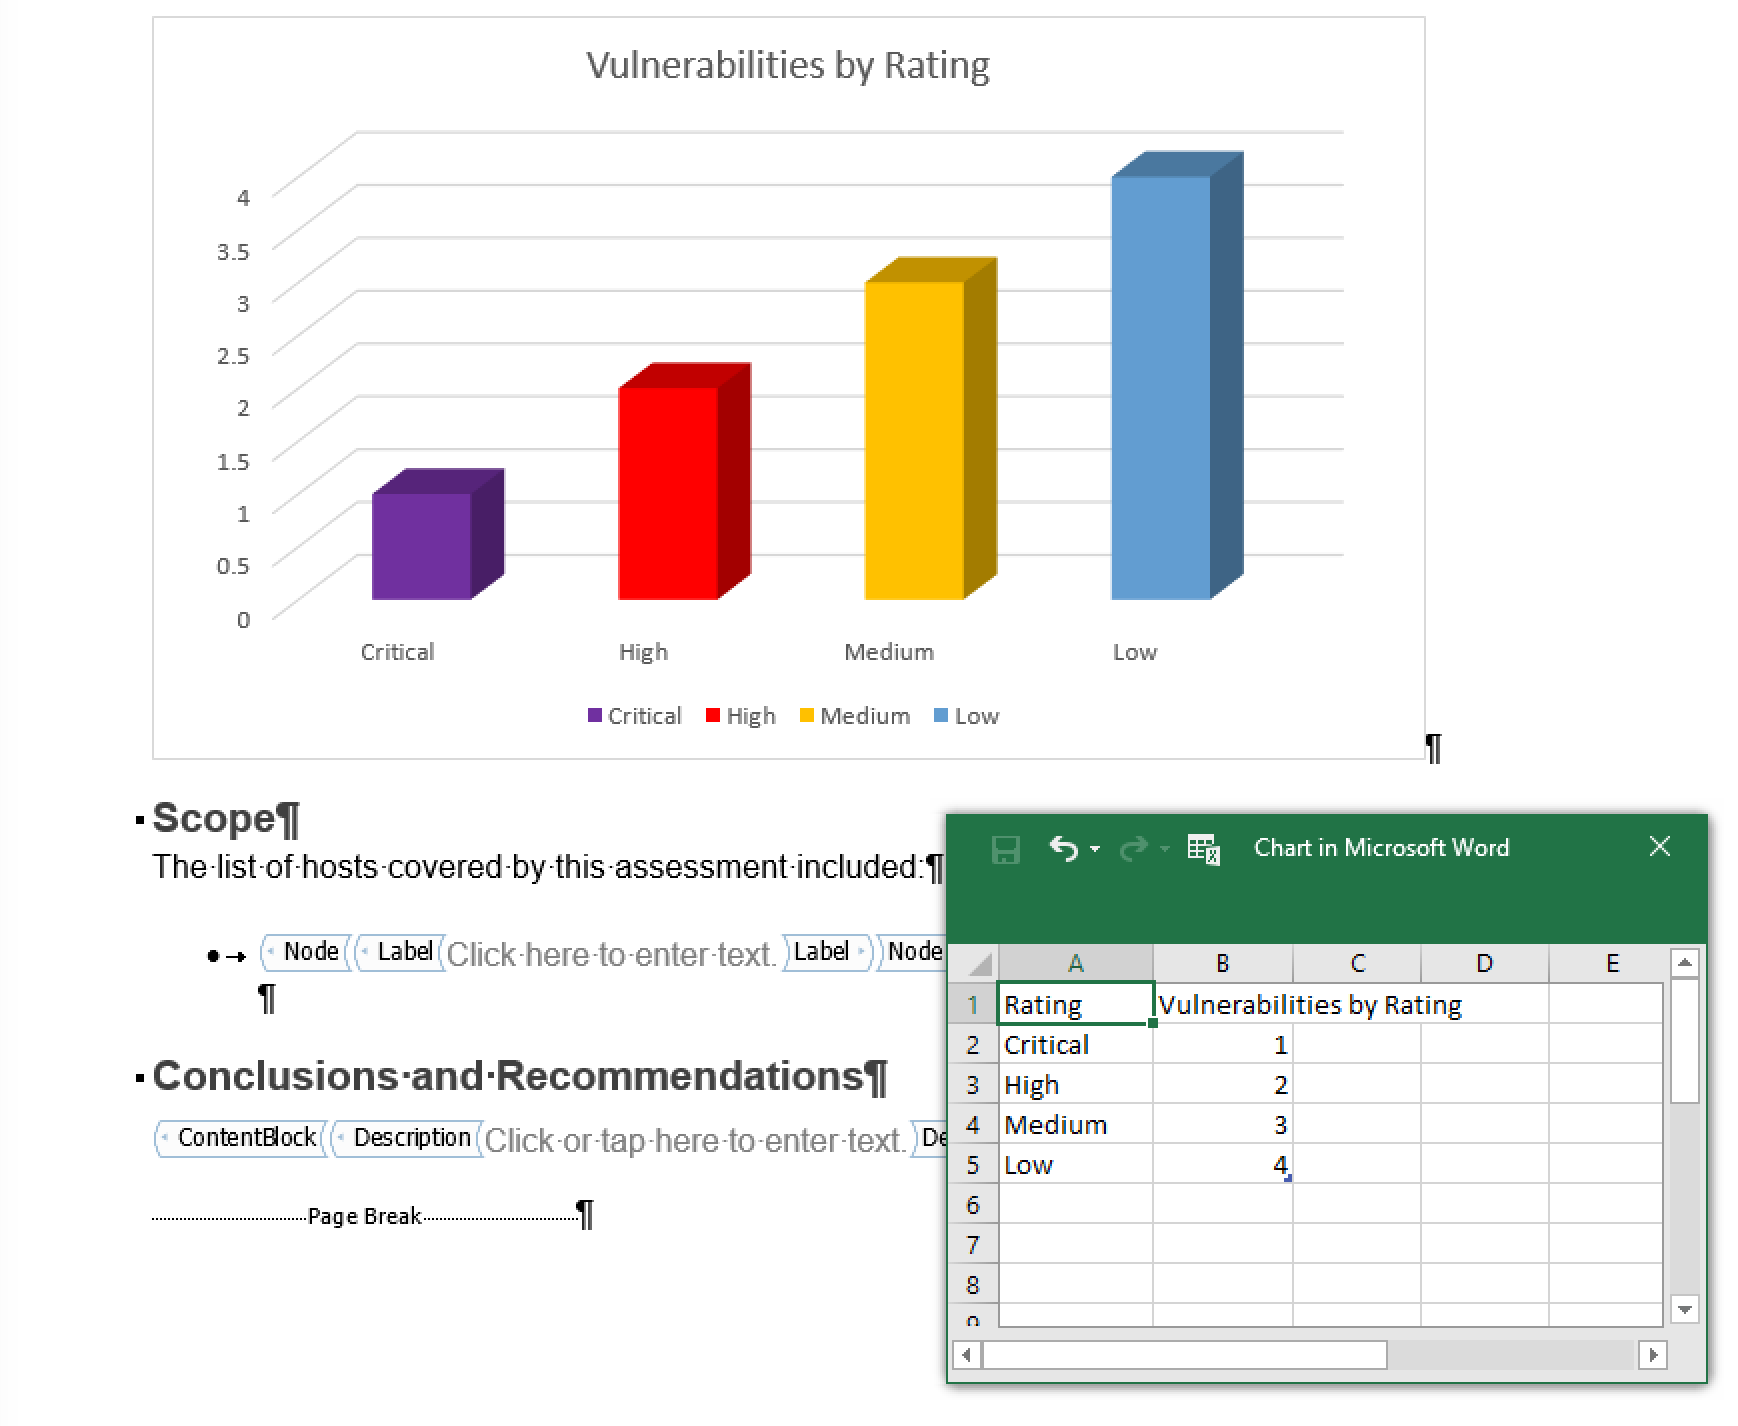
Update the chart so that it looks the way you want! Work on the colors, borders, layout, legend, sizes and more. Don't forget about the data either! Make sure to open up the Excel sheet (right click and select Edit Data > Edit data in Excel) and edit the data with some placeholder labels and data.
-
As of Dradis v4.3, Word charts that count Issues (e.g. the number of issues rated
Critical, or the number of Issues within a range of CVSS scores ofType|Web), or that count Issues per Node, can be auto-generated by Dradis during the export phase. To do so, you will need to create a secondDradisFiltersworksheet with the filters to be used on Issues for the chart.Note: The first worksheet with the source data you are working with, and which will update on export with the chart data, must be called
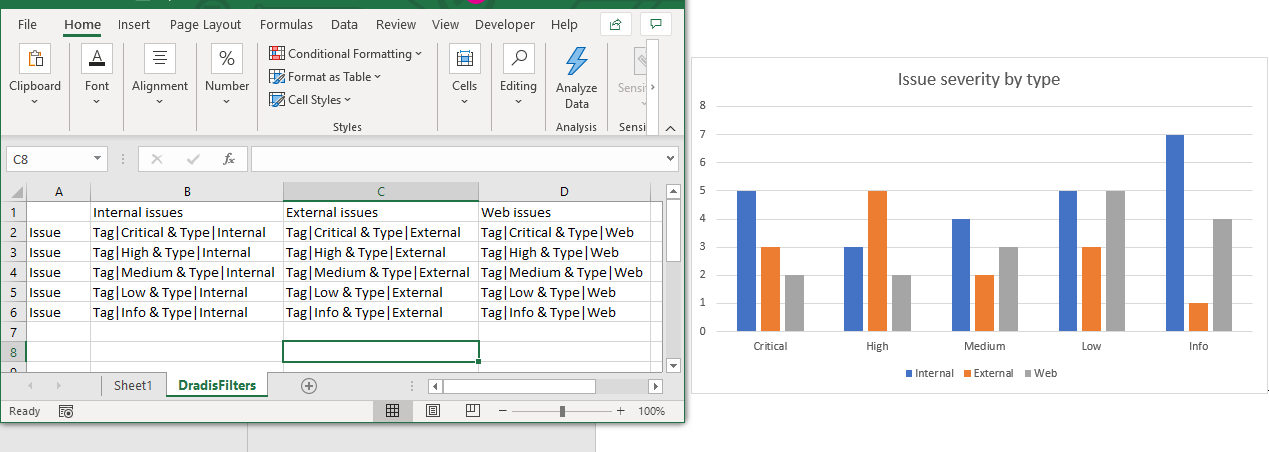
Sheet1. This is the default sheet name for English-localised Word/Office, but if you are using another language localisation, you may need to rename that worksheet!In the below example, we have a chart where we want to show the count of Issues of each severity rating.
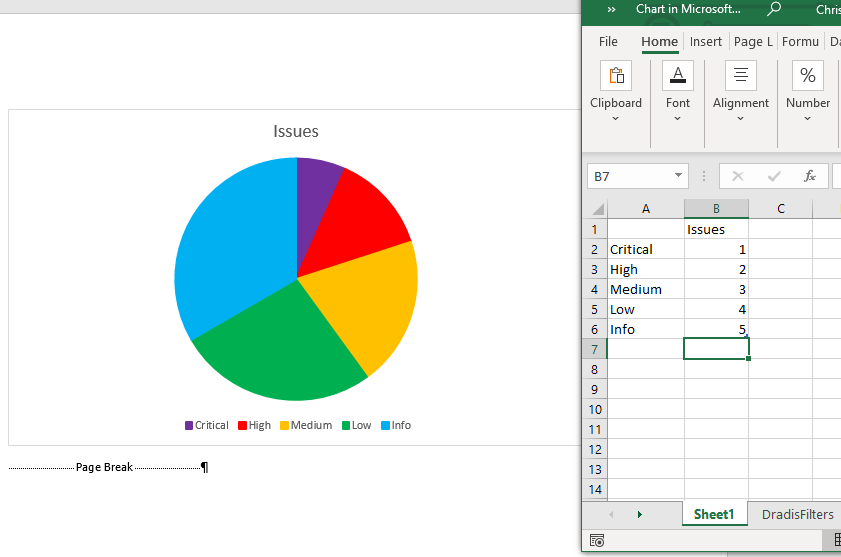
So we create a
DradisFiltersworksheet covering the same cells we use in the source data sheet, withIssuein the first column to show that we are parsing Issues, and the filter to be used in subsequent columns.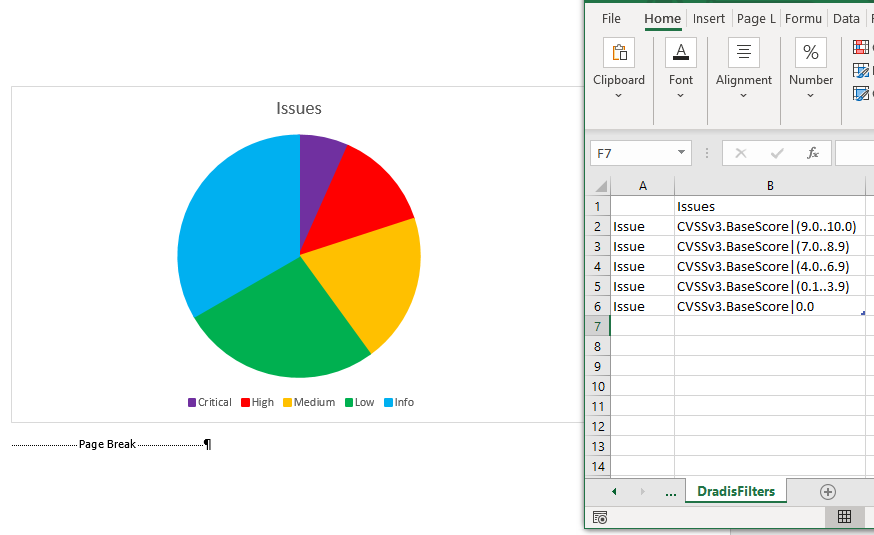
We can have multiple columns for complex charts!
For the count of Issues by Node, put
Node|Issuein the first column and filters for issues in any subsequent columns.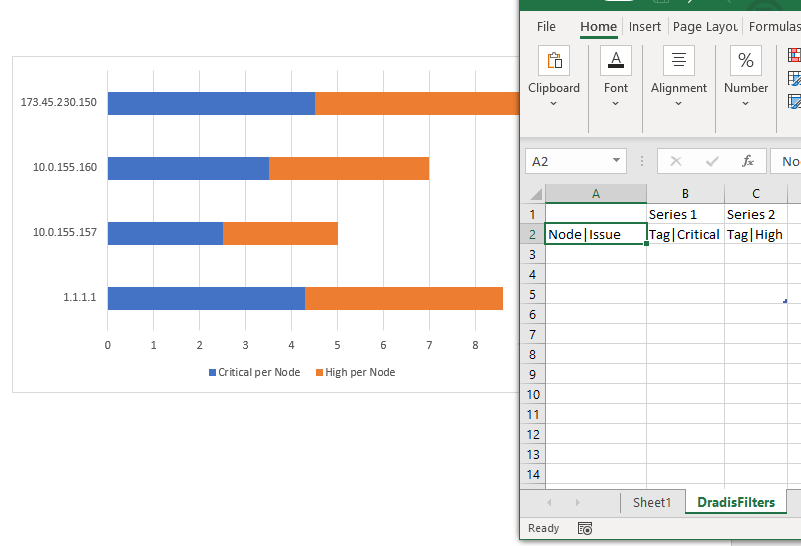
For Dradis of v4.3 or later, you're done! These filters will be parsed by Dradis during the export phase.
Otherwise, if you are working with a pre-v4.3 instance of Dradis or if you are charting something other than Issues (e.g. if you want to count Evidence per Issue, or counting open ports found by Nmap, etc.) then make sure to update Cell A1 with a single word (e.g.
Rating), we'll be using this later!
Count the content using a source chart
-
Now that you have your placeholder chart in your report template, we have to make sure we can update that chart with the project-specific data, if that could not be done using the
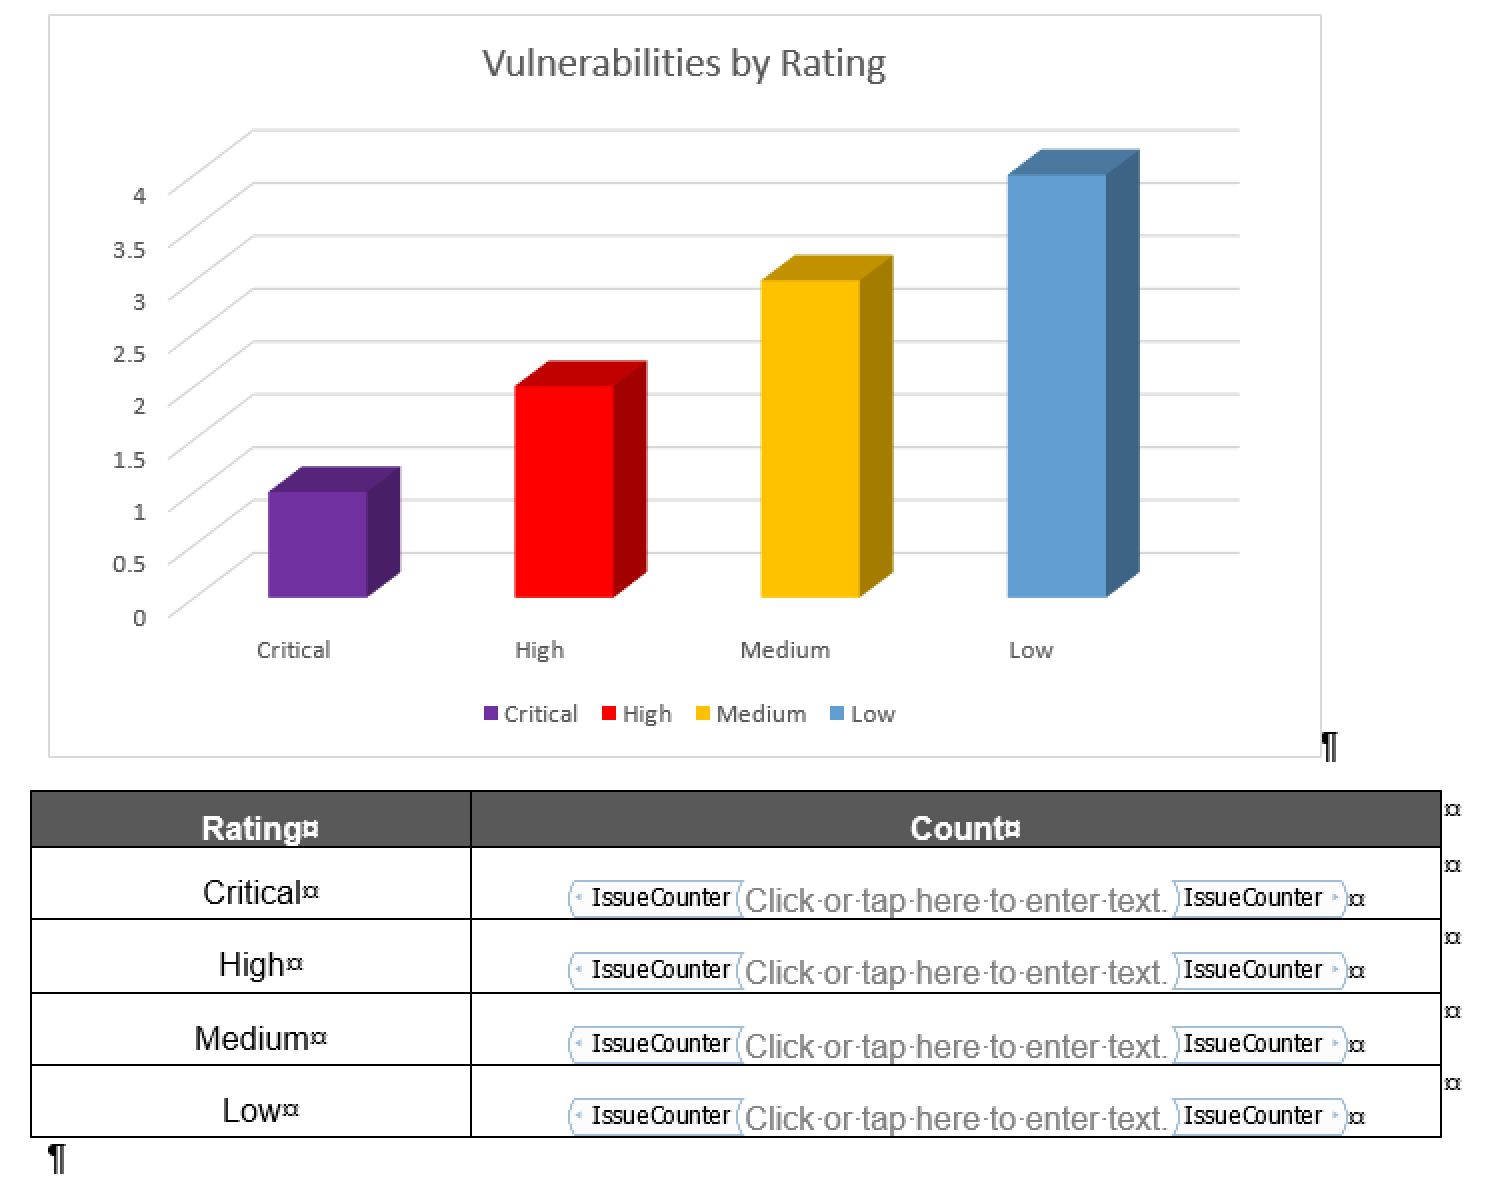
DradisFilterssheet process described above.The easiest way to do this is usually with content controls such as IssueCounter controls in a placeholder table that has the same layout as the Excel sheet hidden behind the chart.
In the example above, we have an Excel sheet with 2 columns and 5 rows so we'll create the same size placeholder table:
-
Finally, make sure that this placeholder table contains a bookmark so that we can reference this placeholder table later with our macro.
In Word, navigate to the Insert tab and click Links > Bookmarks and give it the name
tblData: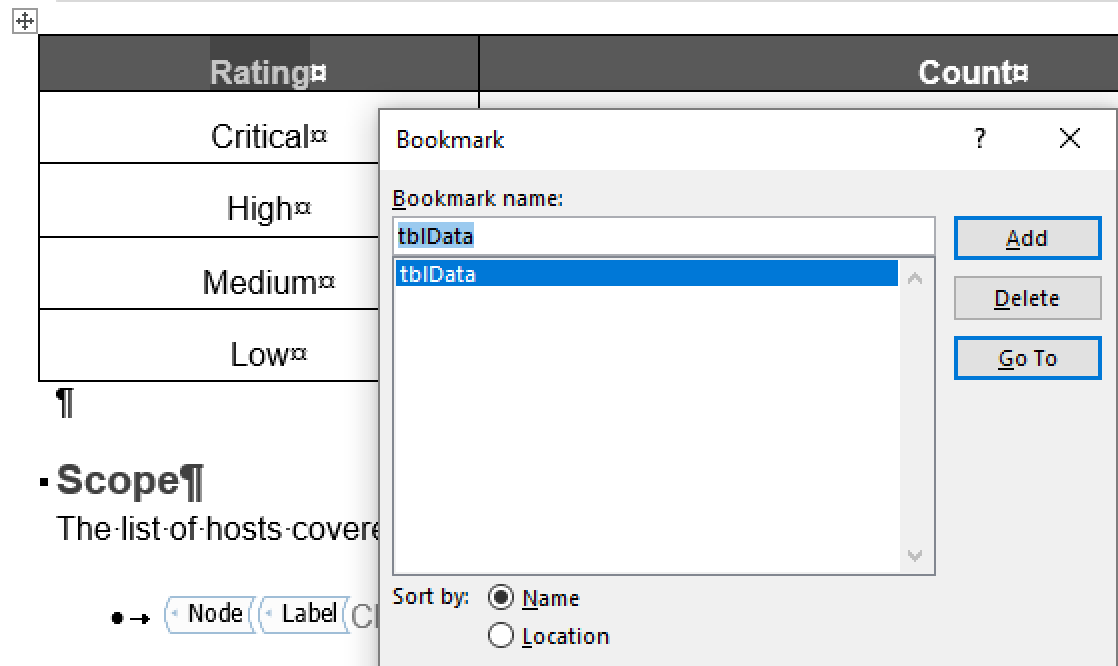
Update the chart with a custom macro
If you are not using the DradisFilters approach described above, you will need to use a post-export macro to update charts in your template.
Note, this macro will not work if you are running Word for Mac. Read more about the VBA limitations of Word for Mac in our FAQs.
-
Add the following macro to your report template:
Sub UpdateChart()
    Dim dataTable As Table

    Dim objShape As InlineShape
    Dim salesChart As Chart
    Dim chartWorkSheet As Excel.worksheet

    ' Iterates each inline shape in the active document.
    For Each objShape In ActiveDocument.InlineShapes
        ' If the inline shape contains a chart, display the
        ' data and minimize the application
        If objShape.HasChart Then

            Set salesChart = objShape.Chart

            salesChart.ChartData.Activate

            salesChart.ChartData.Workbook.Application.WindowState = -4140

            Set chartWorkSheet = salesChart.ChartData.Workbook.WorkSheets(1)

            If chartWorkSheet.Range("A1").FormulaR1C1 = "Rating" Then
                Call UpdateByRatingChart(chartWorkSheet)
            End If
        End If
    Next
End Sub
Make sure to update this line:
If chartWorkSheet.Range("A1").FormulaR1C1 = "Rating" Thenas needed so that the macro is looking for the actual value you used cell A1 when you created the chart.More than one chart in your report?
Use
ElseIfto differentiate between charts:If chartWorkSheet.Range("A1").FormulaR1C1 = "Rating" Then Call UpdateRatingChart(chartWorkSheet) ElseIf chartWorkSheet.Range("A1").FormulaR1C1 = "Cat" Then Call UpdateCategoryChart(chartWorkSheet) End If -
Now, you see how we're calling
UpdateByRatingChartin our previous macro? It's time to define that function next! In the same macro, add the following lines:Private Sub UpdateByRatingChart(worksheet As Excel.worksheet) Dim tblData As Table Dim intR As Integer Set tblData = ActiveDocument.GoTo(What:=wdGoToBookmark, Name:="tblData").Tables(1) For intR = 2 to 5 worksheet.Range("B" & intR).FormulaR1C1 = CleanCellText(tblData.Cell(intR, 2)) Next intR ActiveDocument.GoTo(What:=wdGoToBookmark, Name:="tblData").Tables(1).Delete End Sub Private Function CleanCellText(objCell As Cell) Dim strCellText As String strCellText = objCell.Range.Text CleanCellText = Trim(Left(strCellText, Len(strCellText) - 2)) End FunctionNotice that we're using that
tblDatabookmark heavily here so that the macro knows which table to pull the chart data from. We're also including a separate function to clean out the cell text.Don't want to delete the placeholder table?
Remove this line or comment it out with a
'ActiveDocument.GoTo(What:=wdGoToBookmark, Name:="tblData").Tables(1).Delete
-
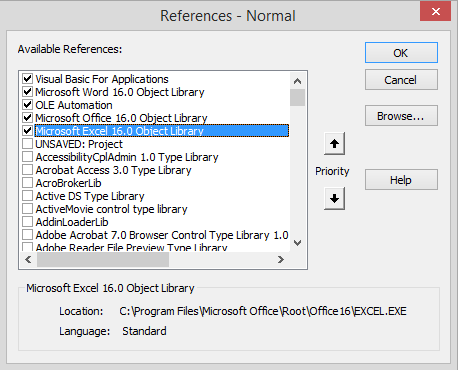
Lastly, since we're setting referencing the Excel worksheets in our macros, we need to include the Excel library. In the macro edit view, click on Tools > References. A window should appear and enable the entry: Microsoft Excel X.Y Object Library. Click OK to save your changes.
Once you have all of the pieces in place, export a sample report and test out your macro.
As always, the Dradis support team is here to help. Contact us if you're having trouble with a report template and we can help!
Next help article: Node content controls →