The Welcome Pack Report Template
This page contains:
- The Welcome Pack Word template
- The Executive Summary Section
- Summary of Findings Section
- Detailed Internal and External Findings
- Methodology Tasks Completed
- Export your Welcome Pack Report
The Welcome Pack Word template
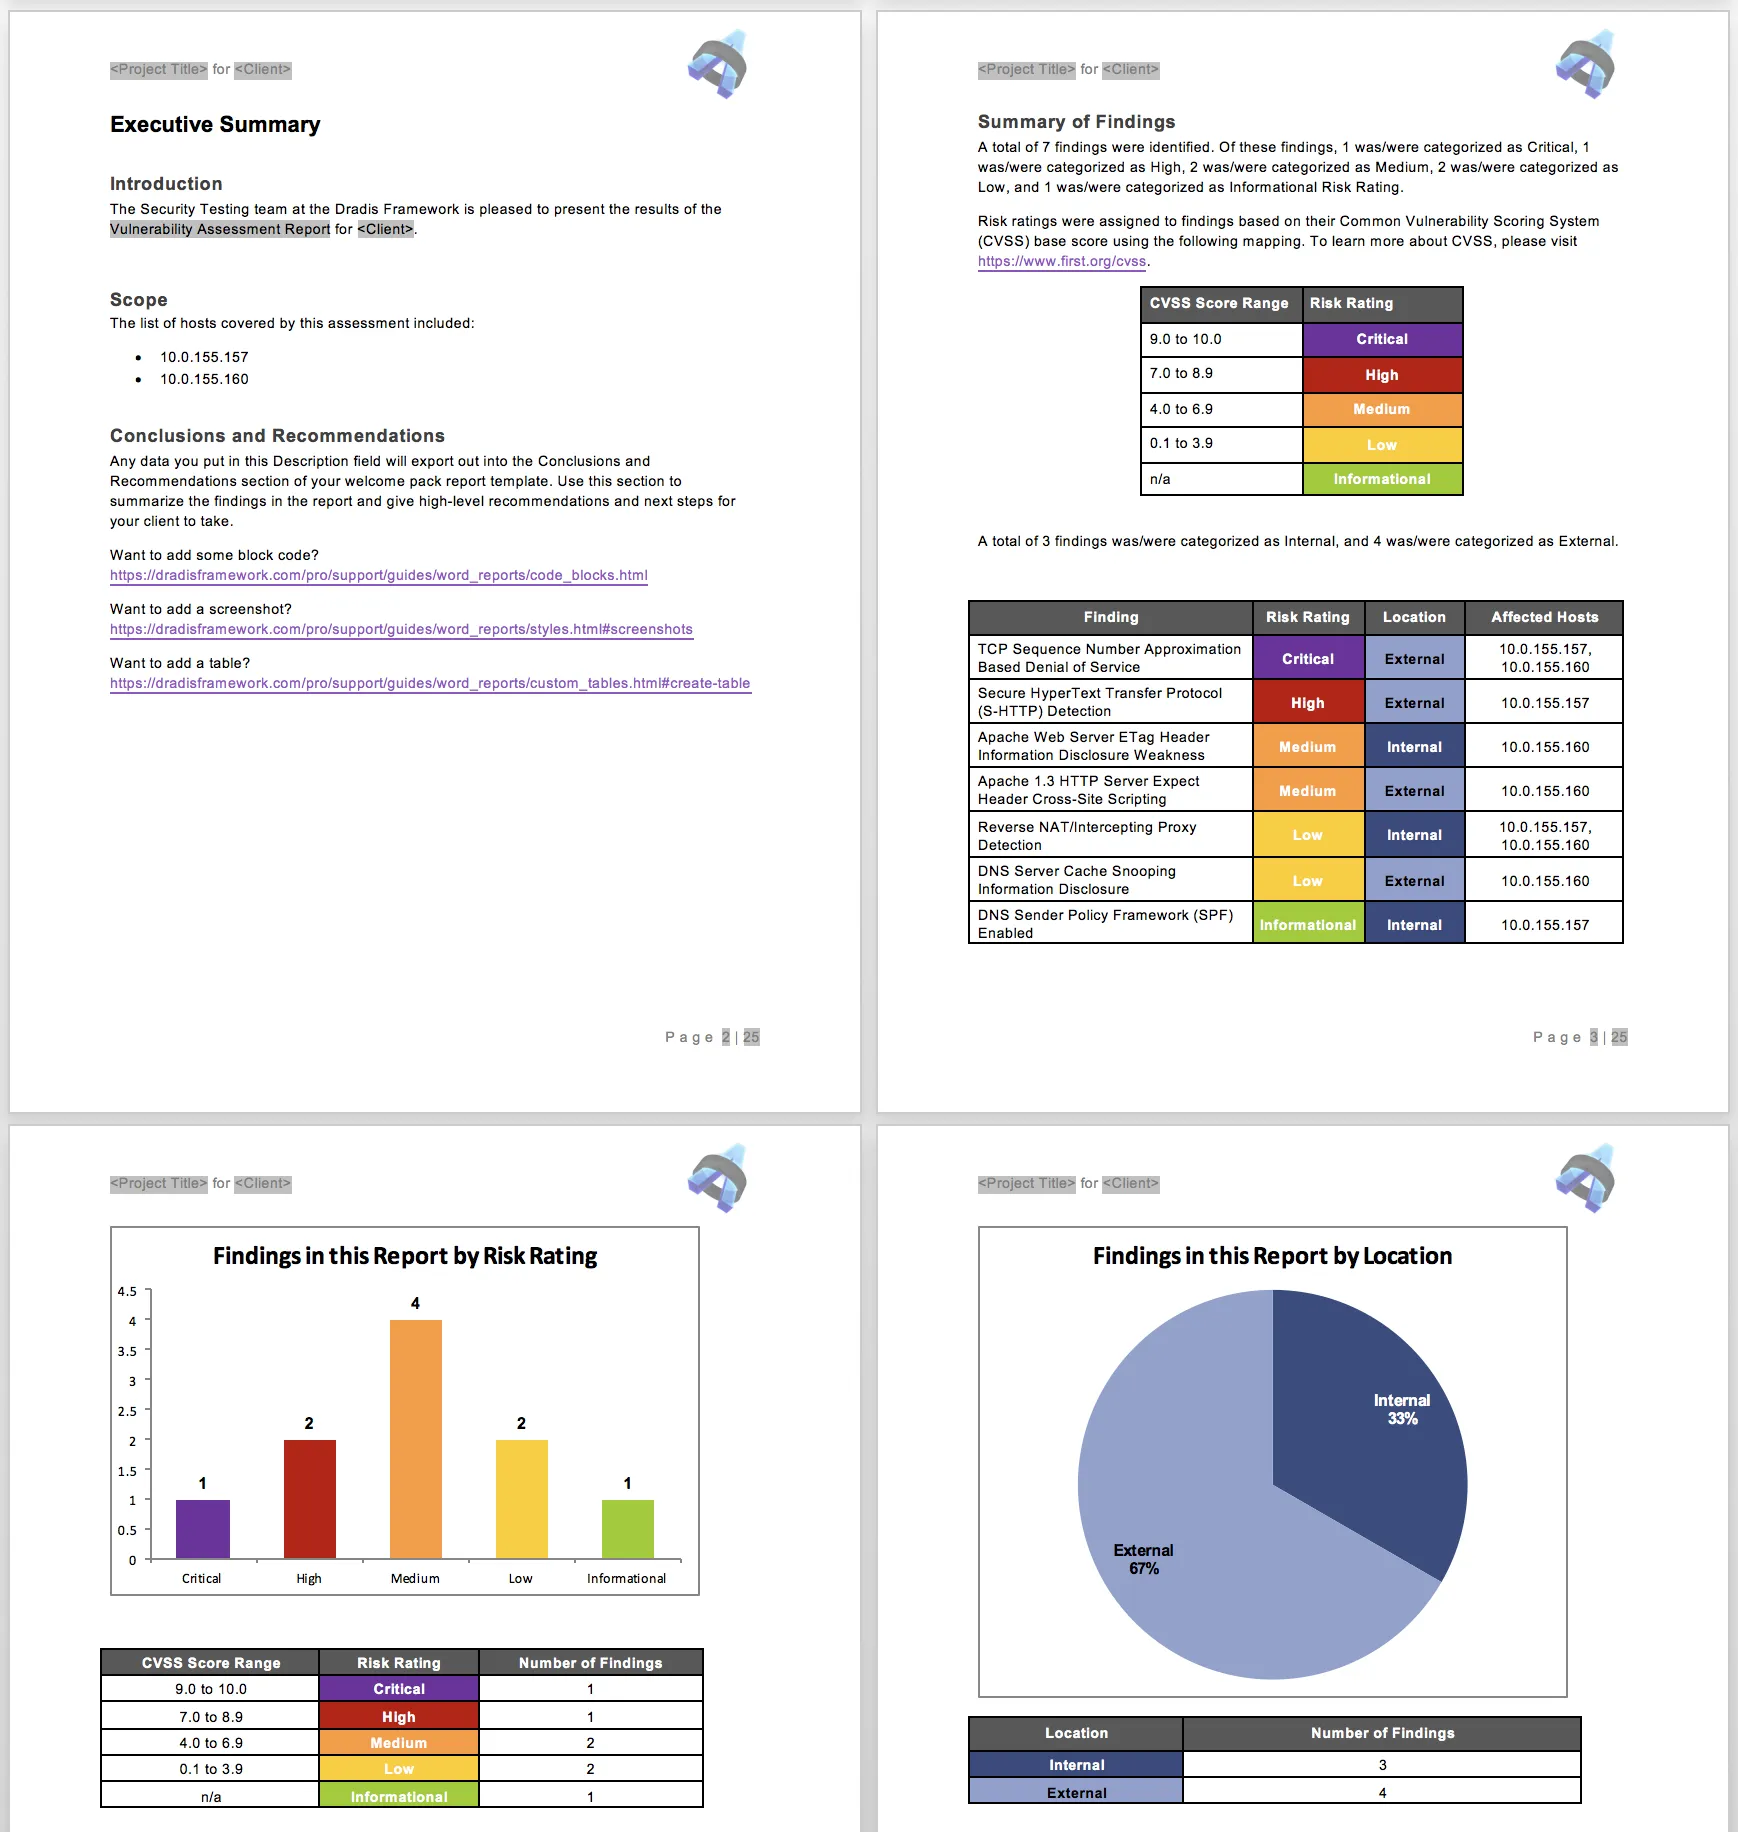
The Word Report Template: dradis_template-welcome.v0.#.docx is a custom Dradis report template. Findings are organized by CVSSv4 base score and Content Blocks contain your project-specific details. Two charts display Issues by Risk Rating (based on CVSSv4 score) and Location (Internal vs External).
Issues are mapped to Risk Ratings based on the following CVSSv4 base score ranges:
CVSSv4 9.0 to 10.0 = Critical
CVSSv4 7.0 to 8.9 = High
CVSSv4 4.0 to 6.9 = Medium
CVSSv4 0.1 to 3.9 = Low
CVSSv4 0.0 = Informational
The Executive Summary Section
The Introduction subsection opens with some static text that is populated with project-specific document properties. The Report Content page in your sample project contains the values that will populate the Project Title (dradis.project), Client (dradis.client), v1 (dradis.version), and Author (dradis.author) placeholders throughout your report template.
The Scope subsection contains a Node content control. When you export your report, this section will contain a bullet point list of all of the affected hosts in your project.
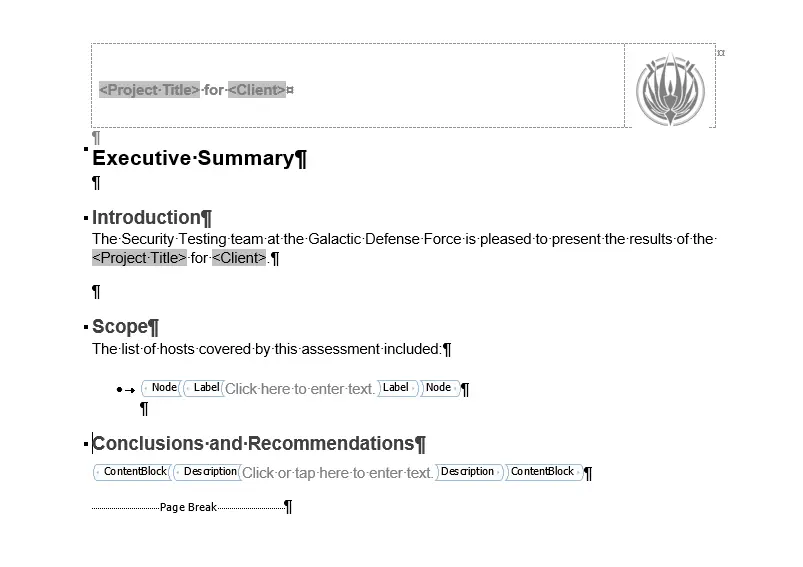
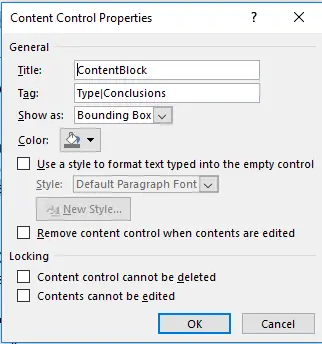
The Conclusions and Recommendations subsection contains a ContentBlock content control that is going to export the content from the Conclusions and Recommendations Content Block on the Report Content page in your sample project.
When you open up the properties of this ContentBlock content control, you'll see that it is being filtered. This means that only Content Blocks with a Type field value of Conclusions are going to export into this section of your report template.
Summary of Findings Section
The Summary of Findings section opens with a block of static text that is populated by IssueCounter content controls to give you a summary of the Issues in your project.
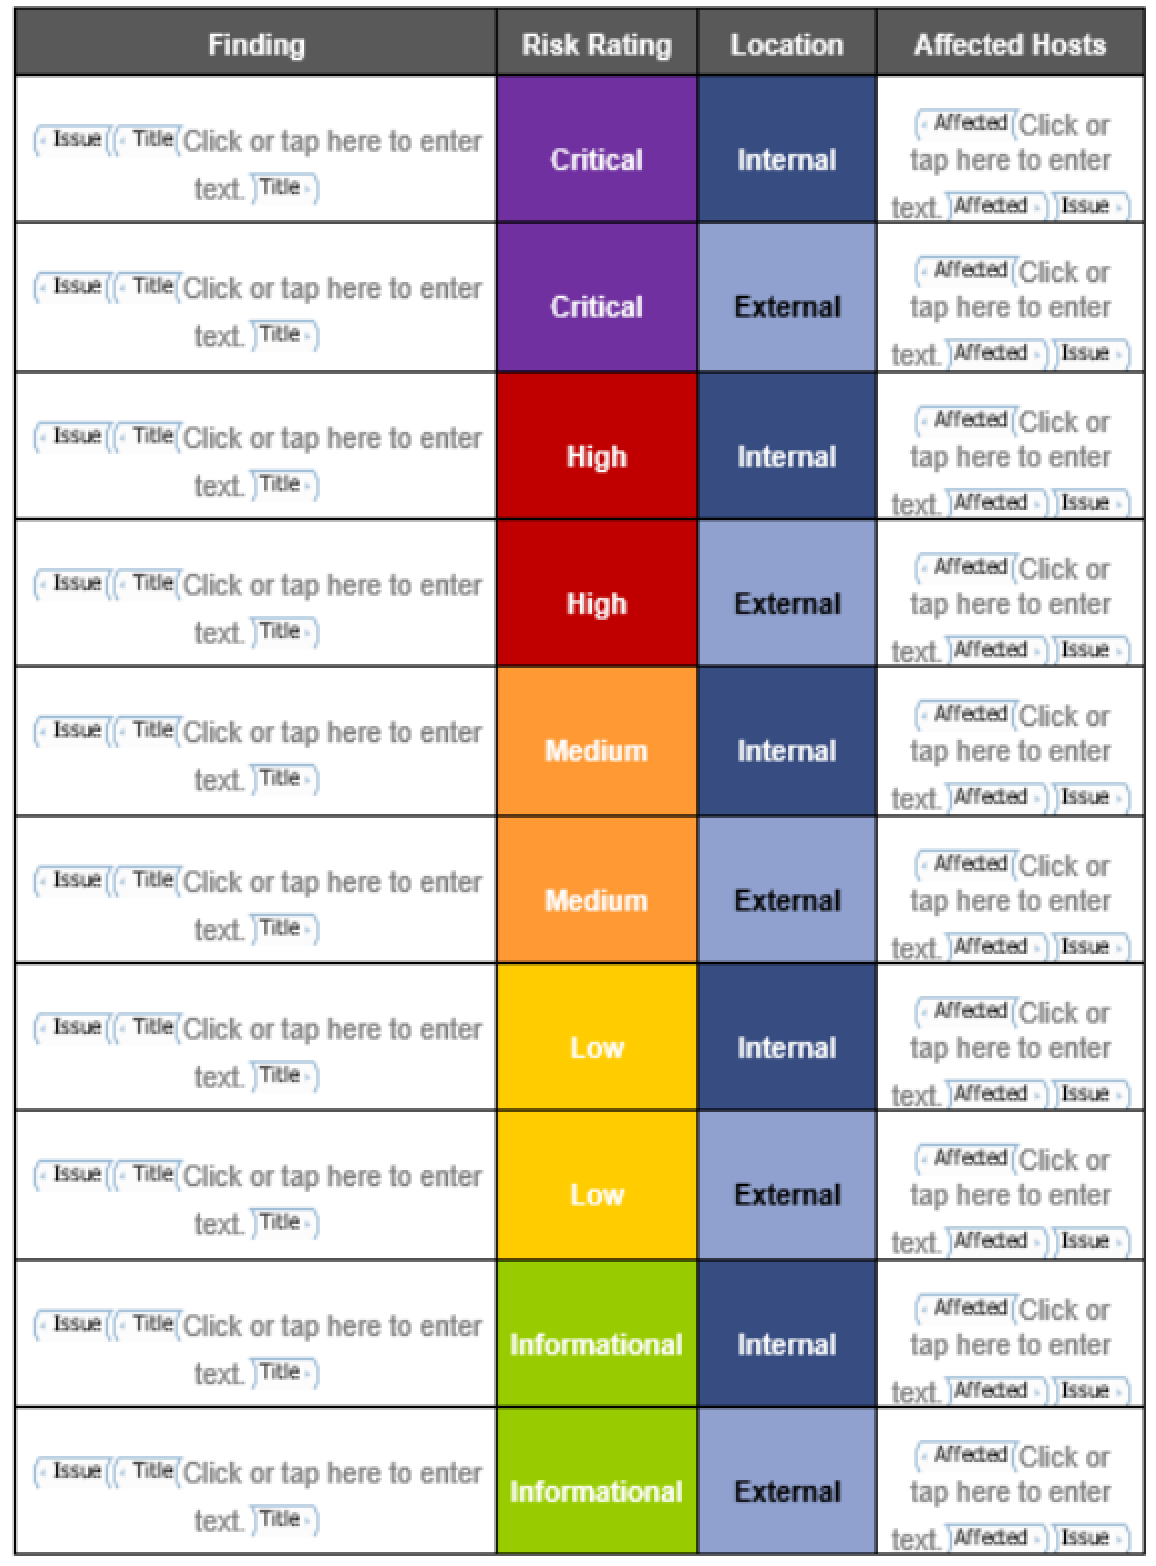
The Summary of Findings table displays every Issue in the project and is organized first by Risk Rating (based on the CVSSv4 score ranges), then by location (Internal / External). The Affected Hosts column will display a comma-separated list of all of the host that the specific Issue affects.
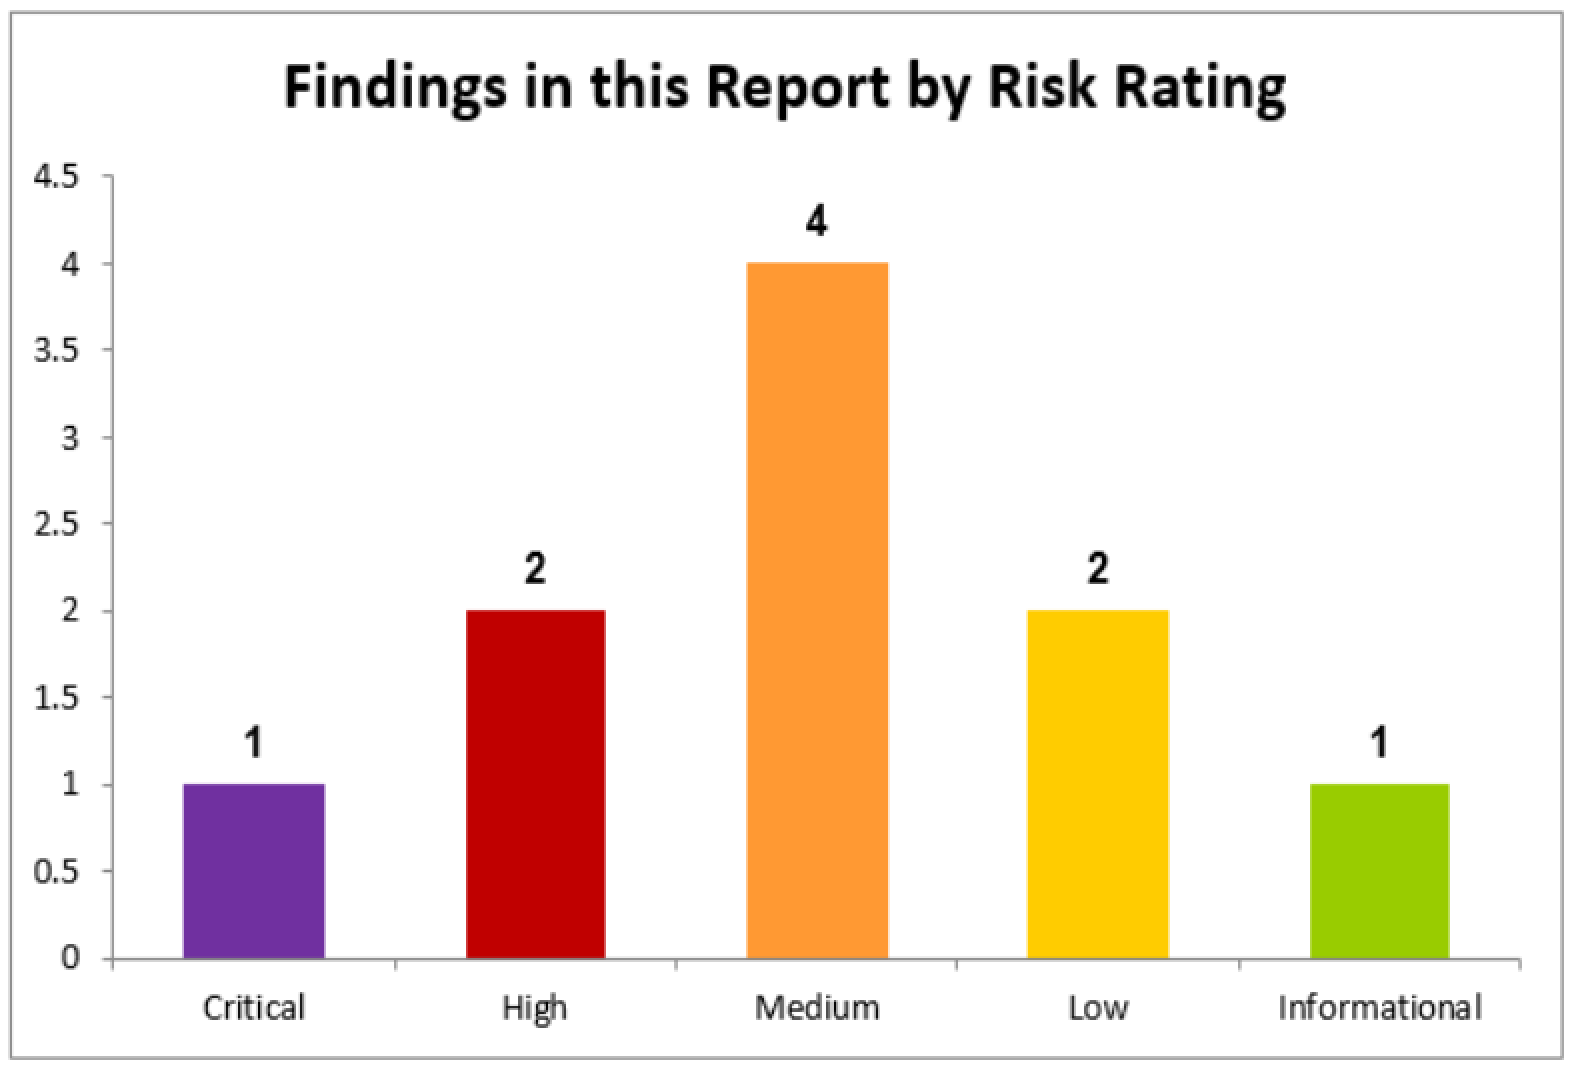
The first chart in this report is a bar chart that shows the number of Issues by Risk Rating.
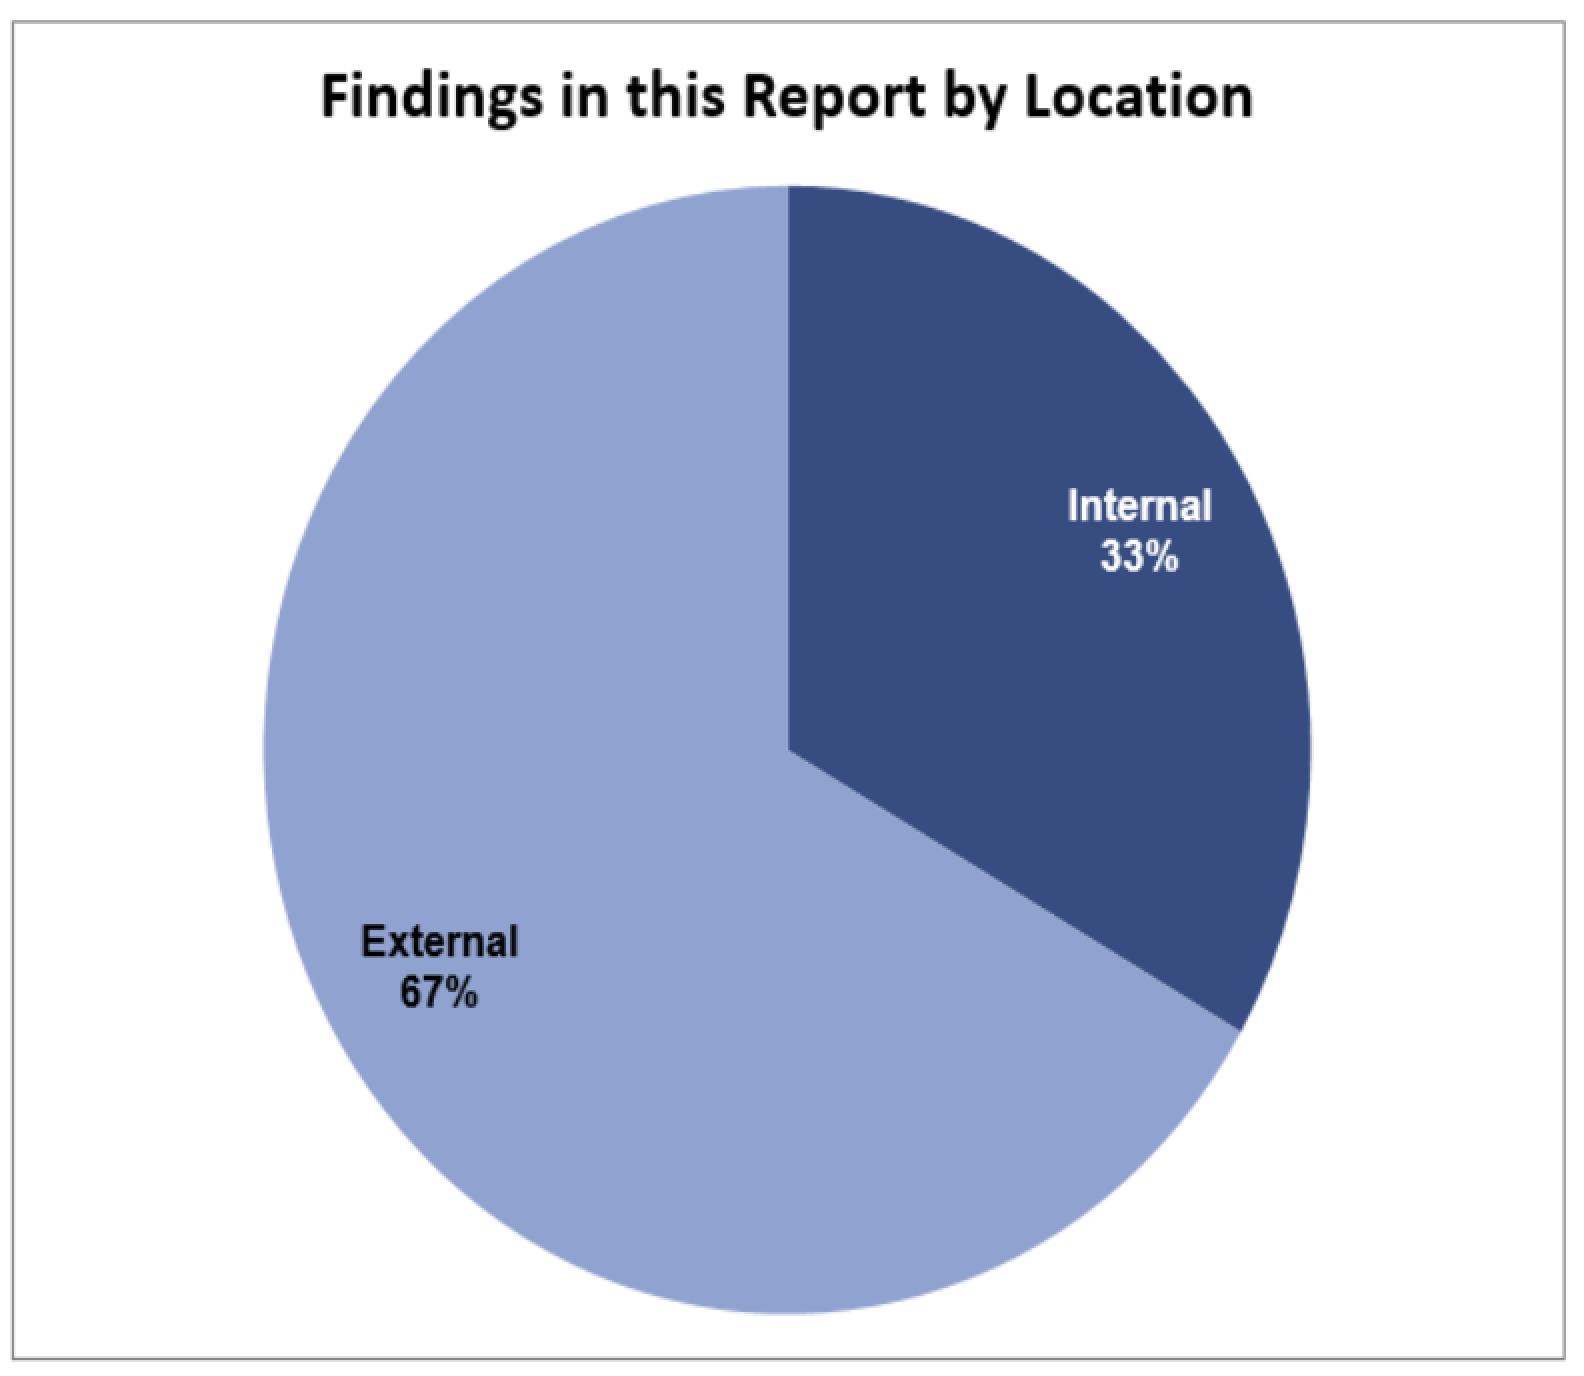
The second chart in this report is a pie chart that shows the number of Issues by location.
Detailed Internal and External Findings
The Internal and External findings are separated into two sections.
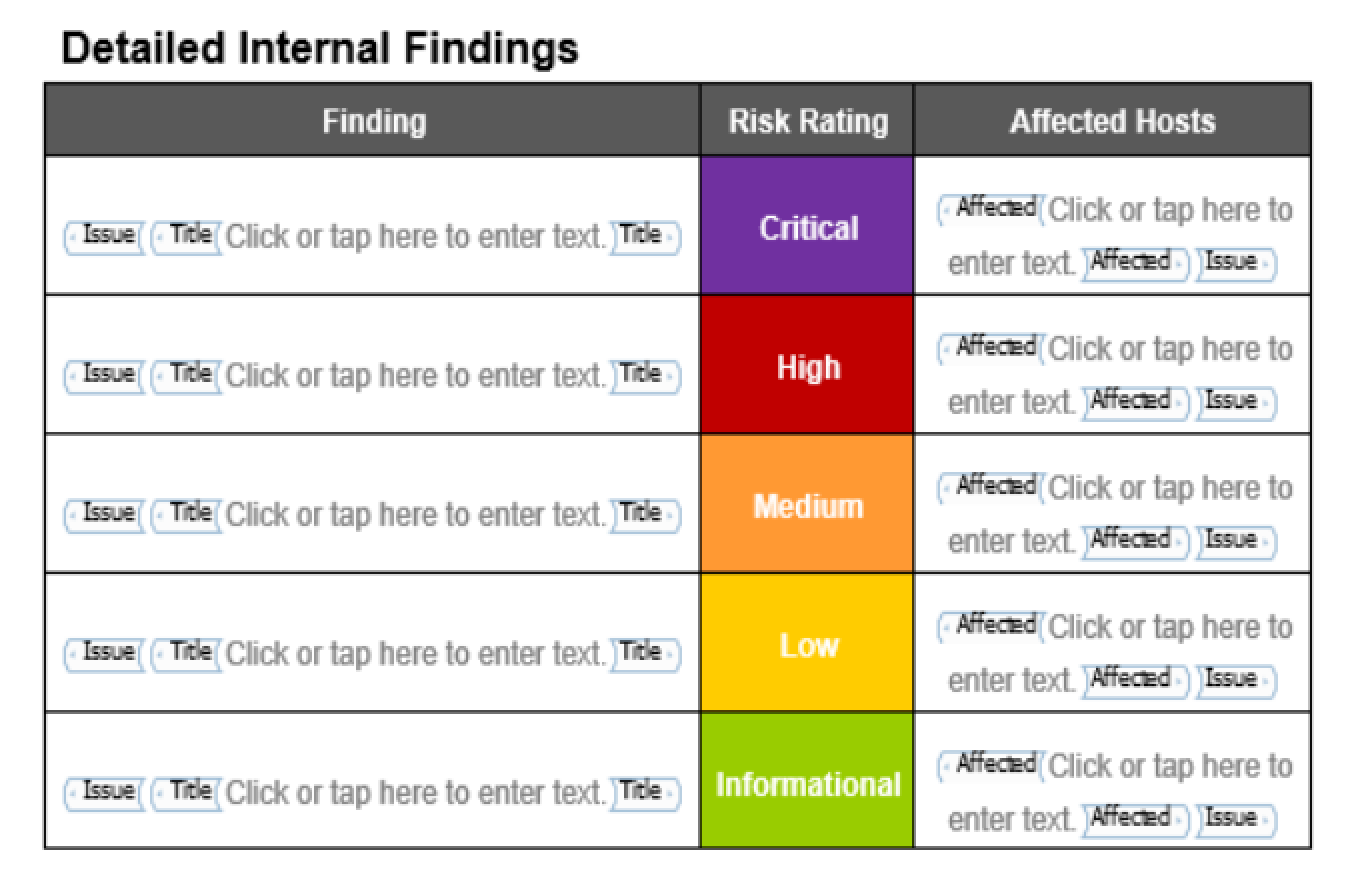
Each starts with a summary table that shows just the Issues in that location, organized by Risk Rating.
Below, the detailed findings are exported in the same order they appear in the summary table. The full details for each Issue will export here including the Description, Solution, and the Location and Output for each instance of Evidence associated with the Issue.
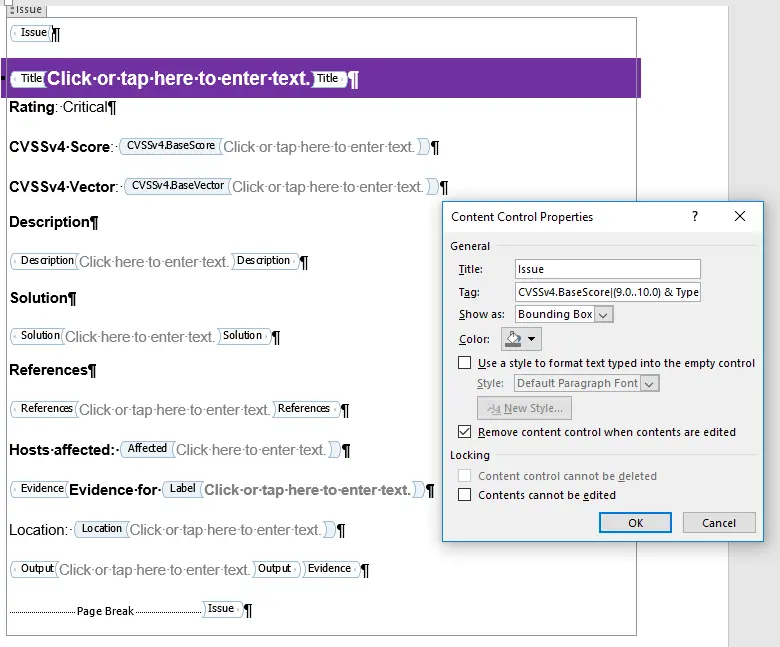
If you open the properties of the Issue content control, you can see that the Issues in this project are being filtered by both CVSSv4.BaseScore and Type. In this case, only the Issues with a CVSSv4.BaseScore field value of from 9.0 to 10.0 as well as a Type field value of Internal will populate this specific Issue content control.
Methodology Tasks Completed
Your sample project contains the OWASP Top 10 - 2021 Methodology.
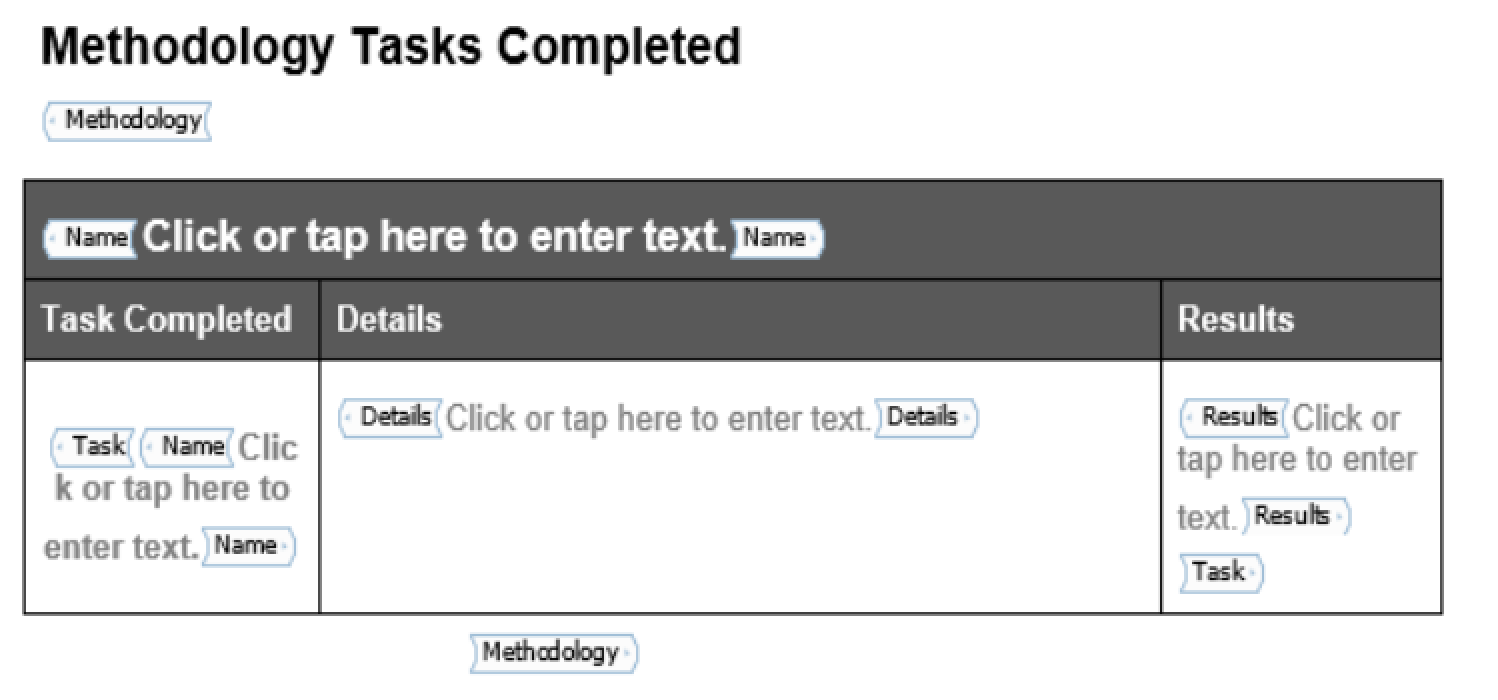
The table in your report template will contain the Methodology name, plus the name, Details, and Results fields from each of the tasks in the Done list (tasks in the Pending list will not export into your report template.
Export your Welcome Pack Report
Check out a preview of what you're about to create:
Next help article: Document properties →