Nessus with Dradis
Step-by-step guide to importing Nessus vulnerability scan results into Dradis. Includes screenshots, field mappings, tips for managing large scan files, and common troubleshooting.

Nessus is a popular and comprehensive vulnerability scanner tool covering security testing for a wide range of technologies, including operating systems, network devices, hypervisors, databases, web servers, and critical infrastructure. With the Dradis Nessus integration, ingest the results of Nessus scans, combine the findings with other tools, update remediation information, and quickly generate a full vulnerability assessment or pentest report.
The Nessus® name, if trademarked, is the intellectual property of the vendor. Uses of the Nessus® name in this page are for identification purposes only and do not imply an endorsement by the trademark owner. Dradis is not endorsed or owned by, or affiliated with, the Nessus® vendor.

Allen Harper
Executive Vice President at Tangible SecurityAvailable for
Support Documentation
Nessus scans generate detailed vulnerability data — plugin IDs, CVSS scores, remediation steps, compliance checks — but consolidating those results across multiple hosts and scans into a coherent pentest report is where most teams lose hours. Dradis eliminates that gap by importing your .nessus files directly, mapping each Nessus plugin to a structured Issue with linked Evidence per host, so you can go from scan output to client-ready report without copy-pasting between tools.
.nessus format (XML v2)| Detail | Value |
|---|---|
| Dradis Plugin | Dradis::Plugins::Nessus |
| Supported File Format | .nessus (Nessus XML v2) |
| Available In | Community Edition and Professional |
| Data Imported | Issues, Evidence, Nodes (hosts), Host properties |
| Typical Import Time | ~5 seconds for 30 findings, ~30 seconds for 500+ |
When you import a .nessus file, the Dradis Nessus plugin parses the XML v2 format and creates three types of objects:
Nodes: Each <ReportHost> in the Nessus file becomes a Node in Dradis. The node label is set to the hostname (e.g., scanme.insecure.org) and host properties like IP address, FQDN, operating system, and MAC address are stored as node properties. All host nodes appear under the Scanner output parent node in the sidebar.
Issues: Each unique Nessus plugin (identified by pluginID) becomes a single Issue in Dradis. If the same plugin fires across 10 hosts, Dradis creates one Issue and links it to all 10 hosts through Evidence. The Issue contains the vulnerability metadata: plugin name as the title, description, solution, CVSS scores, and references.
Evidence: For every host where a plugin fires, Dradis creates an Evidence entry that links the Issue to the specific Node. Evidence captures the port/protocol combination (e.g., tcp/443) and the plugin_output — the host-specific technical details Nessus observed during the scan.
This structure means you avoid duplication: the vulnerability description lives in one place (the Issue), while host-specific details live in Evidence. When you generate a report, you can pull from both.
The Nessus plugin maps these fields to each Issue by default:
| Dradis Field | Nessus Source | Template Variable |
|---|---|---|
| Title | pluginName attribute |
{{ nessus[report_item.plugin_name] }} |
| CVSSv3.BaseScore | <cvss3_base_score> |
{{ nessus[report_item.cvss3_base_score] }} |
| CVSSv3.Vector | <cvss3_vector> |
{{ nessus[report_item.cvss3_vector] }} |
| Type | Static value | Internal |
| Description | <description> |
{{ nessus[report_item.description] }} |
| Solution | <solution> |
{{ nessus[report_item.solution] }} |
| References | <see_also> (all entries) |
{{ nessus[report_item.see_also_entries] }} |
| Dradis Field | Nessus Source | Template Variable |
|---|---|---|
| Location | protocol + port attributes |
{{ nessus[evidence.protocol] }}/{{ nessus[evidence.port] }} |
| Output | <plugin_output> |
{{ nessus[evidence.plugin_output] }} |
| Dradis Field | Nessus Source | Template Variable |
|---|---|---|
| Title | Static value | Nessus host summary |
| Host information | Multiple <tag> elements |
Name, IP, FQDN, OS, MAC, NetBIOS |
| Scan information | HOST_START / HOST_END tags |
Scan start/end timestamps |
Beyond the defaults, the Nessus plugin exposes over 50 additional fields you can use in custom templates (available via the Mappings Manager in Dradis Pro):
Issue fields (report_item.*):
| Field | Description |
|---|---|
report_item.plugin_id |
Nessus plugin ID number |
report_item.plugin_name |
Plugin title |
report_item.plugin_family |
Plugin category (e.g., "Web Servers", "General") |
report_item.severity |
Numeric severity (0=Info, 1=Low, 2=Medium, 3=High, 4=Critical) |
report_item.risk_factor |
Text risk level (None, Low, Medium, High, Critical) |
report_item.synopsis |
Brief one-line summary |
report_item.description |
Full vulnerability description |
report_item.solution |
Remediation guidance |
report_item.see_also_entries |
Reference URLs (newline-separated) |
report_item.cvss3_base_score |
CVSSv3 base score |
report_item.cvss3_vector |
CVSSv3 vector string |
report_item.cvss3_temporal_score |
CVSSv3 temporal score |
report_item.cvss3_temporal_vector |
CVSSv3 temporal vector |
report_item.cvss3_impact_score |
CVSSv3 impact subscore |
report_item.cvss_base_score |
CVSSv2 base score |
report_item.cvss_vector |
CVSSv2 vector string |
report_item.cvss_temporal_score |
CVSSv2 temporal score |
report_item.cvss_temporal_vector |
CVSSv2 temporal vector |
report_item.vpr_score |
Tenable Vulnerability Priority Rating |
report_item.exploit_available |
Whether public exploits exist (true/false) |
report_item.exploitability_ease |
Exploit difficulty description |
report_item.exploit_code_maturity |
Exploit maturity level |
report_item.exploit_framework_metasploit |
Metasploit module available |
report_item.metasploit_name |
Metasploit module name |
report_item.exploit_framework_canvas |
CANVAS exploit available |
report_item.exploit_framework_core |
Core Impact exploit available |
report_item.cve_entries |
CVE identifiers (newline-separated) |
report_item.bid_entries |
Bugtraq IDs (newline-separated) |
report_item.cwe_entries |
CWE identifiers (newline-separated) |
report_item.xref_entries |
Cross-reference IDs (newline-separated) |
report_item.plugin_publication_date |
When the plugin was first published |
report_item.plugin_modification_date |
Last plugin update date |
report_item.vuln_publication_date |
When the vulnerability was disclosed |
report_item.patch_publication_date |
When the vendor patch was released |
report_item.plugin_version |
Plugin revision number |
report_item.plugin_type |
Detection method (remote, local, combined) |
report_item.age_of_vuln |
How long the vulnerability has been known |
report_item.product_coverage |
Tenable product coverage level |
report_item.threat_intensity_last_28 |
Recent threat activity level |
report_item.threat_recency |
Time since last threat activity |
report_item.threat_sources_last_28 |
Recent threat source count |
report_item.port |
Port number |
report_item.protocol |
Protocol (tcp/udp/icmp) |
report_item.svc_name |
Service name (http, ssh, etc.) |
report_item.plugin_output |
Raw scan output |
Evidence fields (evidence.*):
| Field | Description |
|---|---|
evidence.port |
Port where the finding was detected |
evidence.protocol |
Protocol (tcp/udp) |
evidence.svc_name |
Service name |
evidence.severity |
Numeric severity level |
evidence.plugin_output |
Host-specific plugin output |
Host fields (report_host.*):
| Field | Description |
|---|---|
report_host.name |
Hostname or IP from the scan target |
report_host.ip |
IP address |
report_host.fqdn |
Fully Qualified Domain Name |
report_host.operating_system |
Detected OS |
report_host.mac_address |
MAC address |
report_host.netbios_name |
NetBIOS name |
report_host.scan_start_time |
When the host scan started |
report_host.scan_stop_time |
When the host scan finished |
Compliance fields (compliance.*, available in Evidence):
| Field | Description |
|---|---|
compliance.cm_actual_value |
Actual value found on the host |
compliance.cm_audit_file |
Compliance audit file used |
compliance.cm_check_id |
Compliance check identifier |
compliance.cm_check_name |
Human-readable check name |
compliance.cm_info |
Additional compliance information |
compliance.cm_output |
Compliance check output |
compliance.cm_policy_value |
Expected policy value |
compliance.cm_reference |
Compliance framework references (PCI, CIS, etc.) |
compliance.cm_result |
Result: PASSED, FAILED, or WARNING |
compliance.cm_see_also |
Reference URLs |
compliance.cm_solution |
Remediation for compliance failures |
In the Nessus web interface:
.nessus XML format preserves the full data structure that Dradis can parse (plugin metadata, CVSS vectors, compliance data, and host properties)..nessus file to your local machine.The .nessus file is an XML document following Nessus's v2 schema (NessusClientData_v2). Each <ReportHost> contains <ReportItem> elements, one per plugin finding per port.
Log into Dradis and open your project. Click the Upload tab in the navigation bar.
You'll see the Upload Output Files form with three sections: tool selection, record state, and file selection.
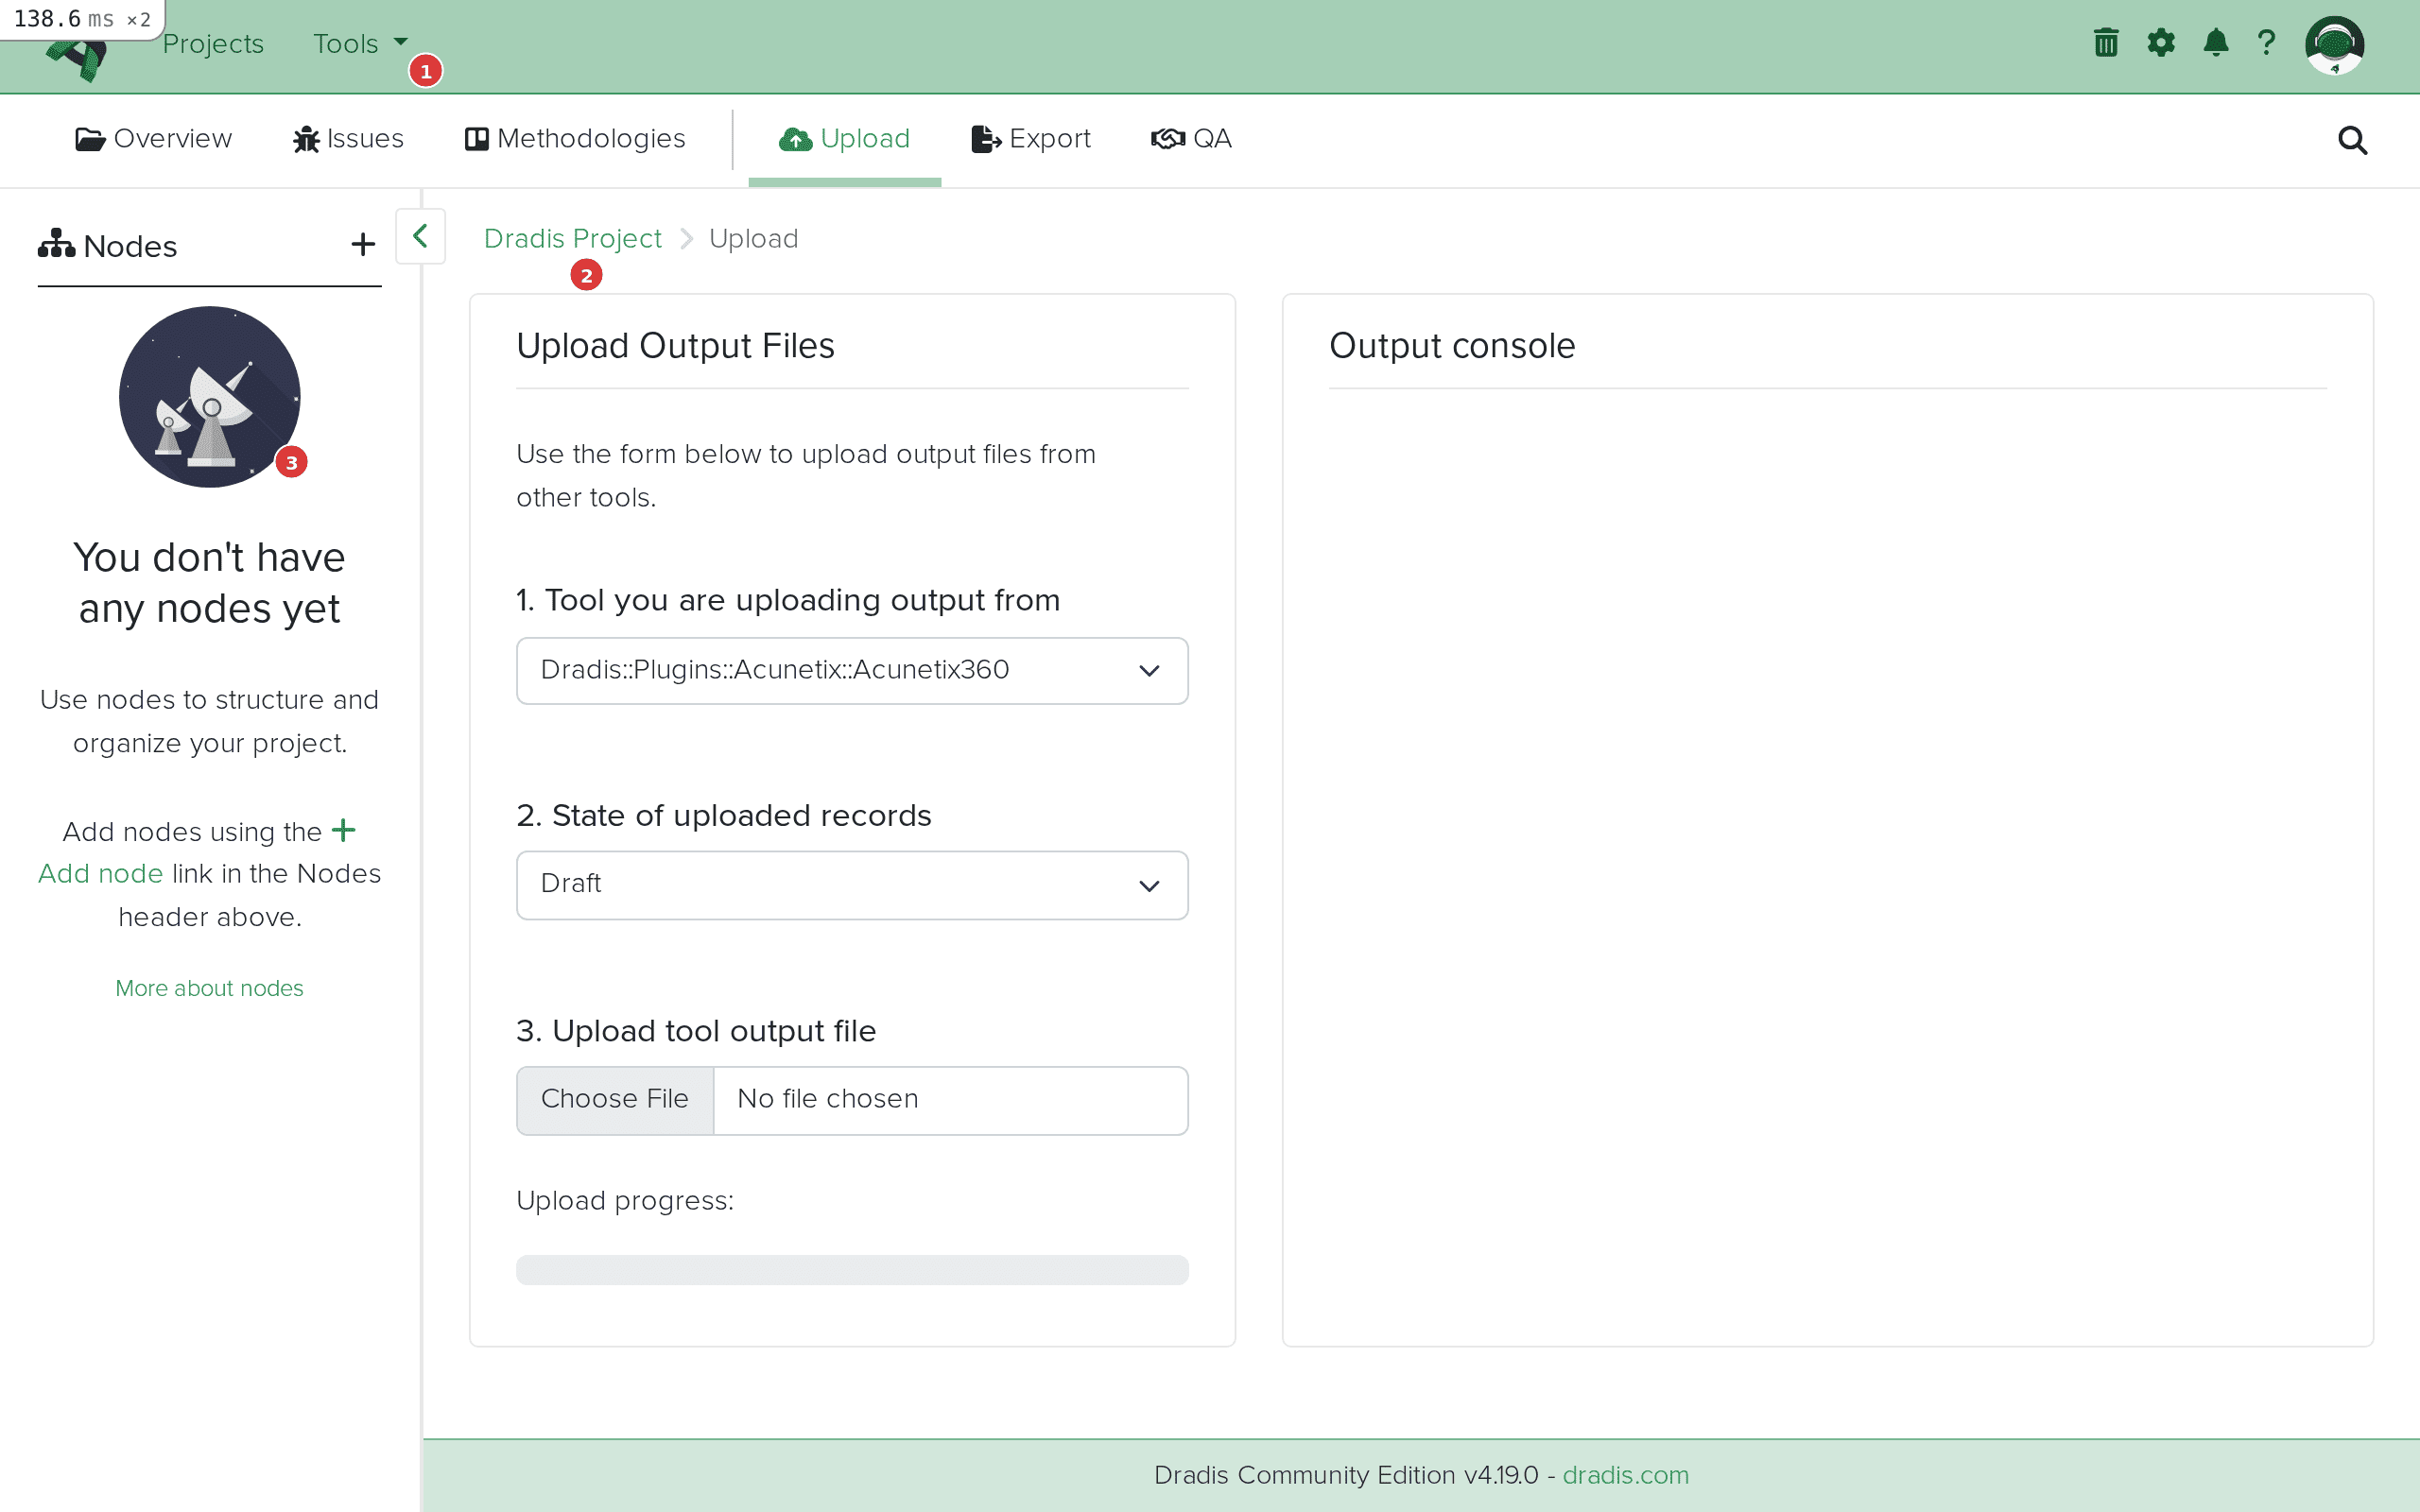 The Upload interface in Dradis. Step 1 (highlighted) selects the plugin, step 2 sets the state, step 3 selects your file.
Click the Tool you are uploading output from dropdown. You can type "Nessus" in the filter field to quickly find it, then select Dradis::Plugins::Nessus.
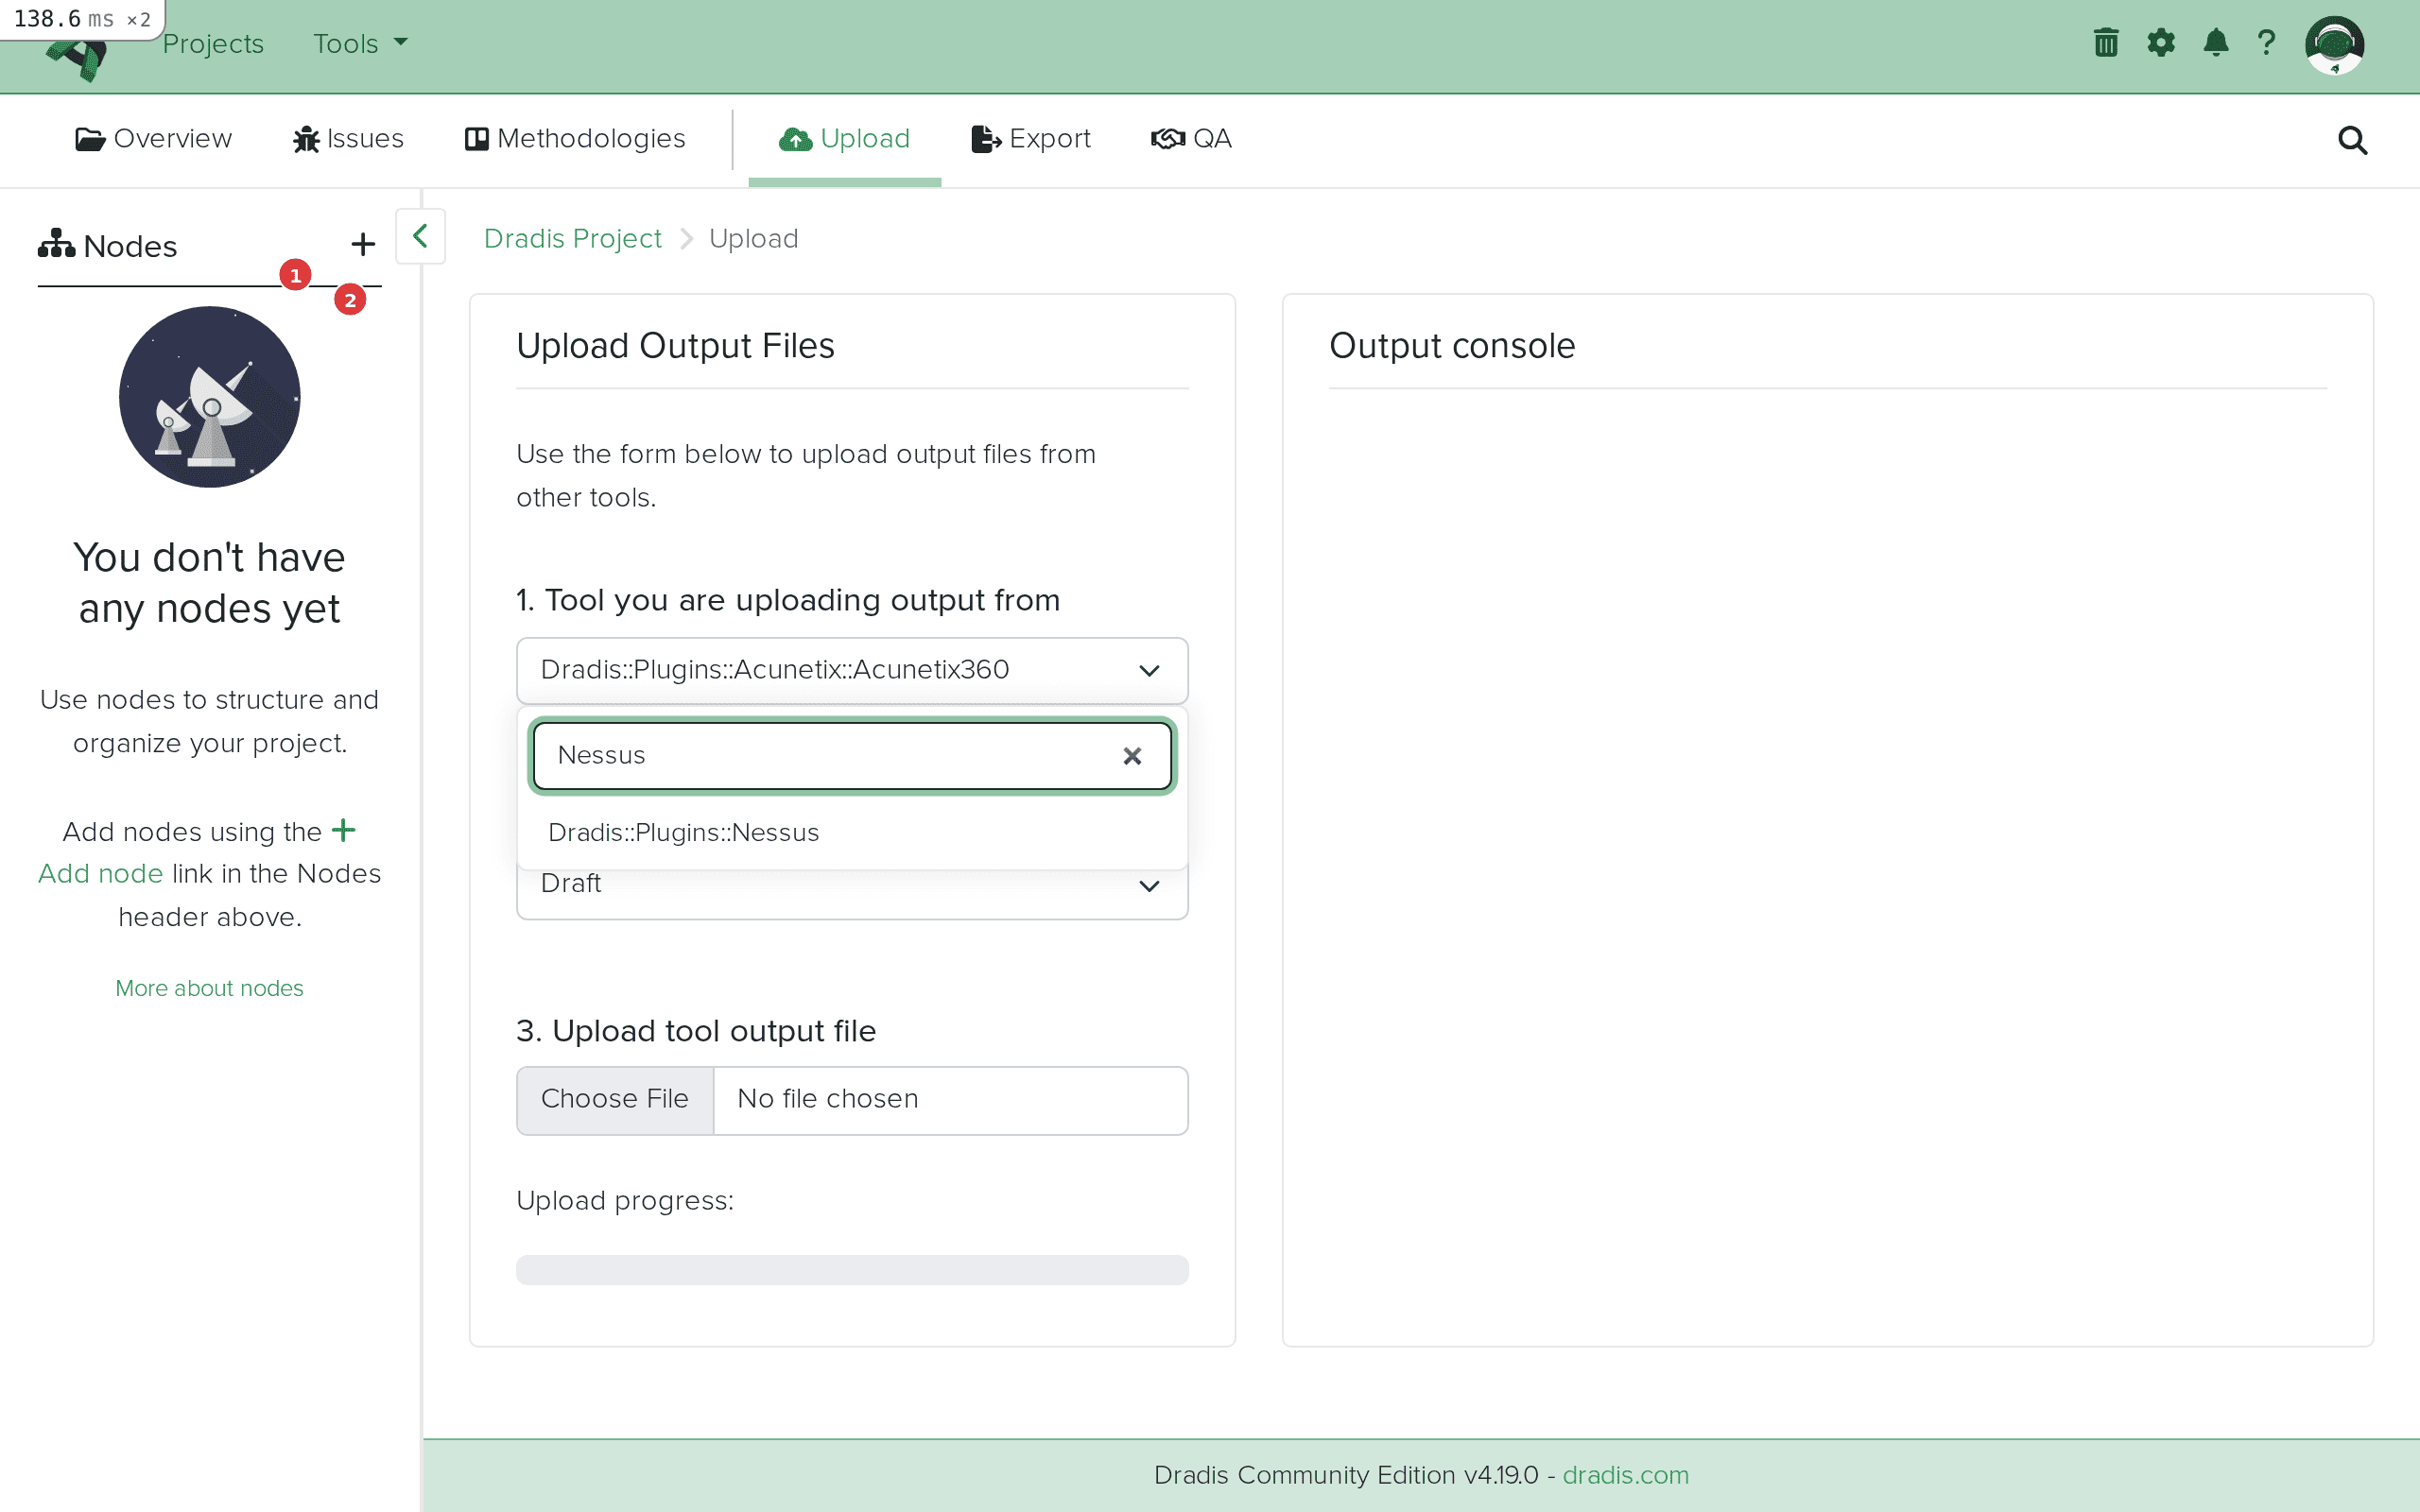 Type "Nessus" in the filter field (1) to quickly locate the Dradis::Plugins::Nessus option (2).
After selecting, the dropdown will show Dradis::Plugins::Nessus as the active plugin.
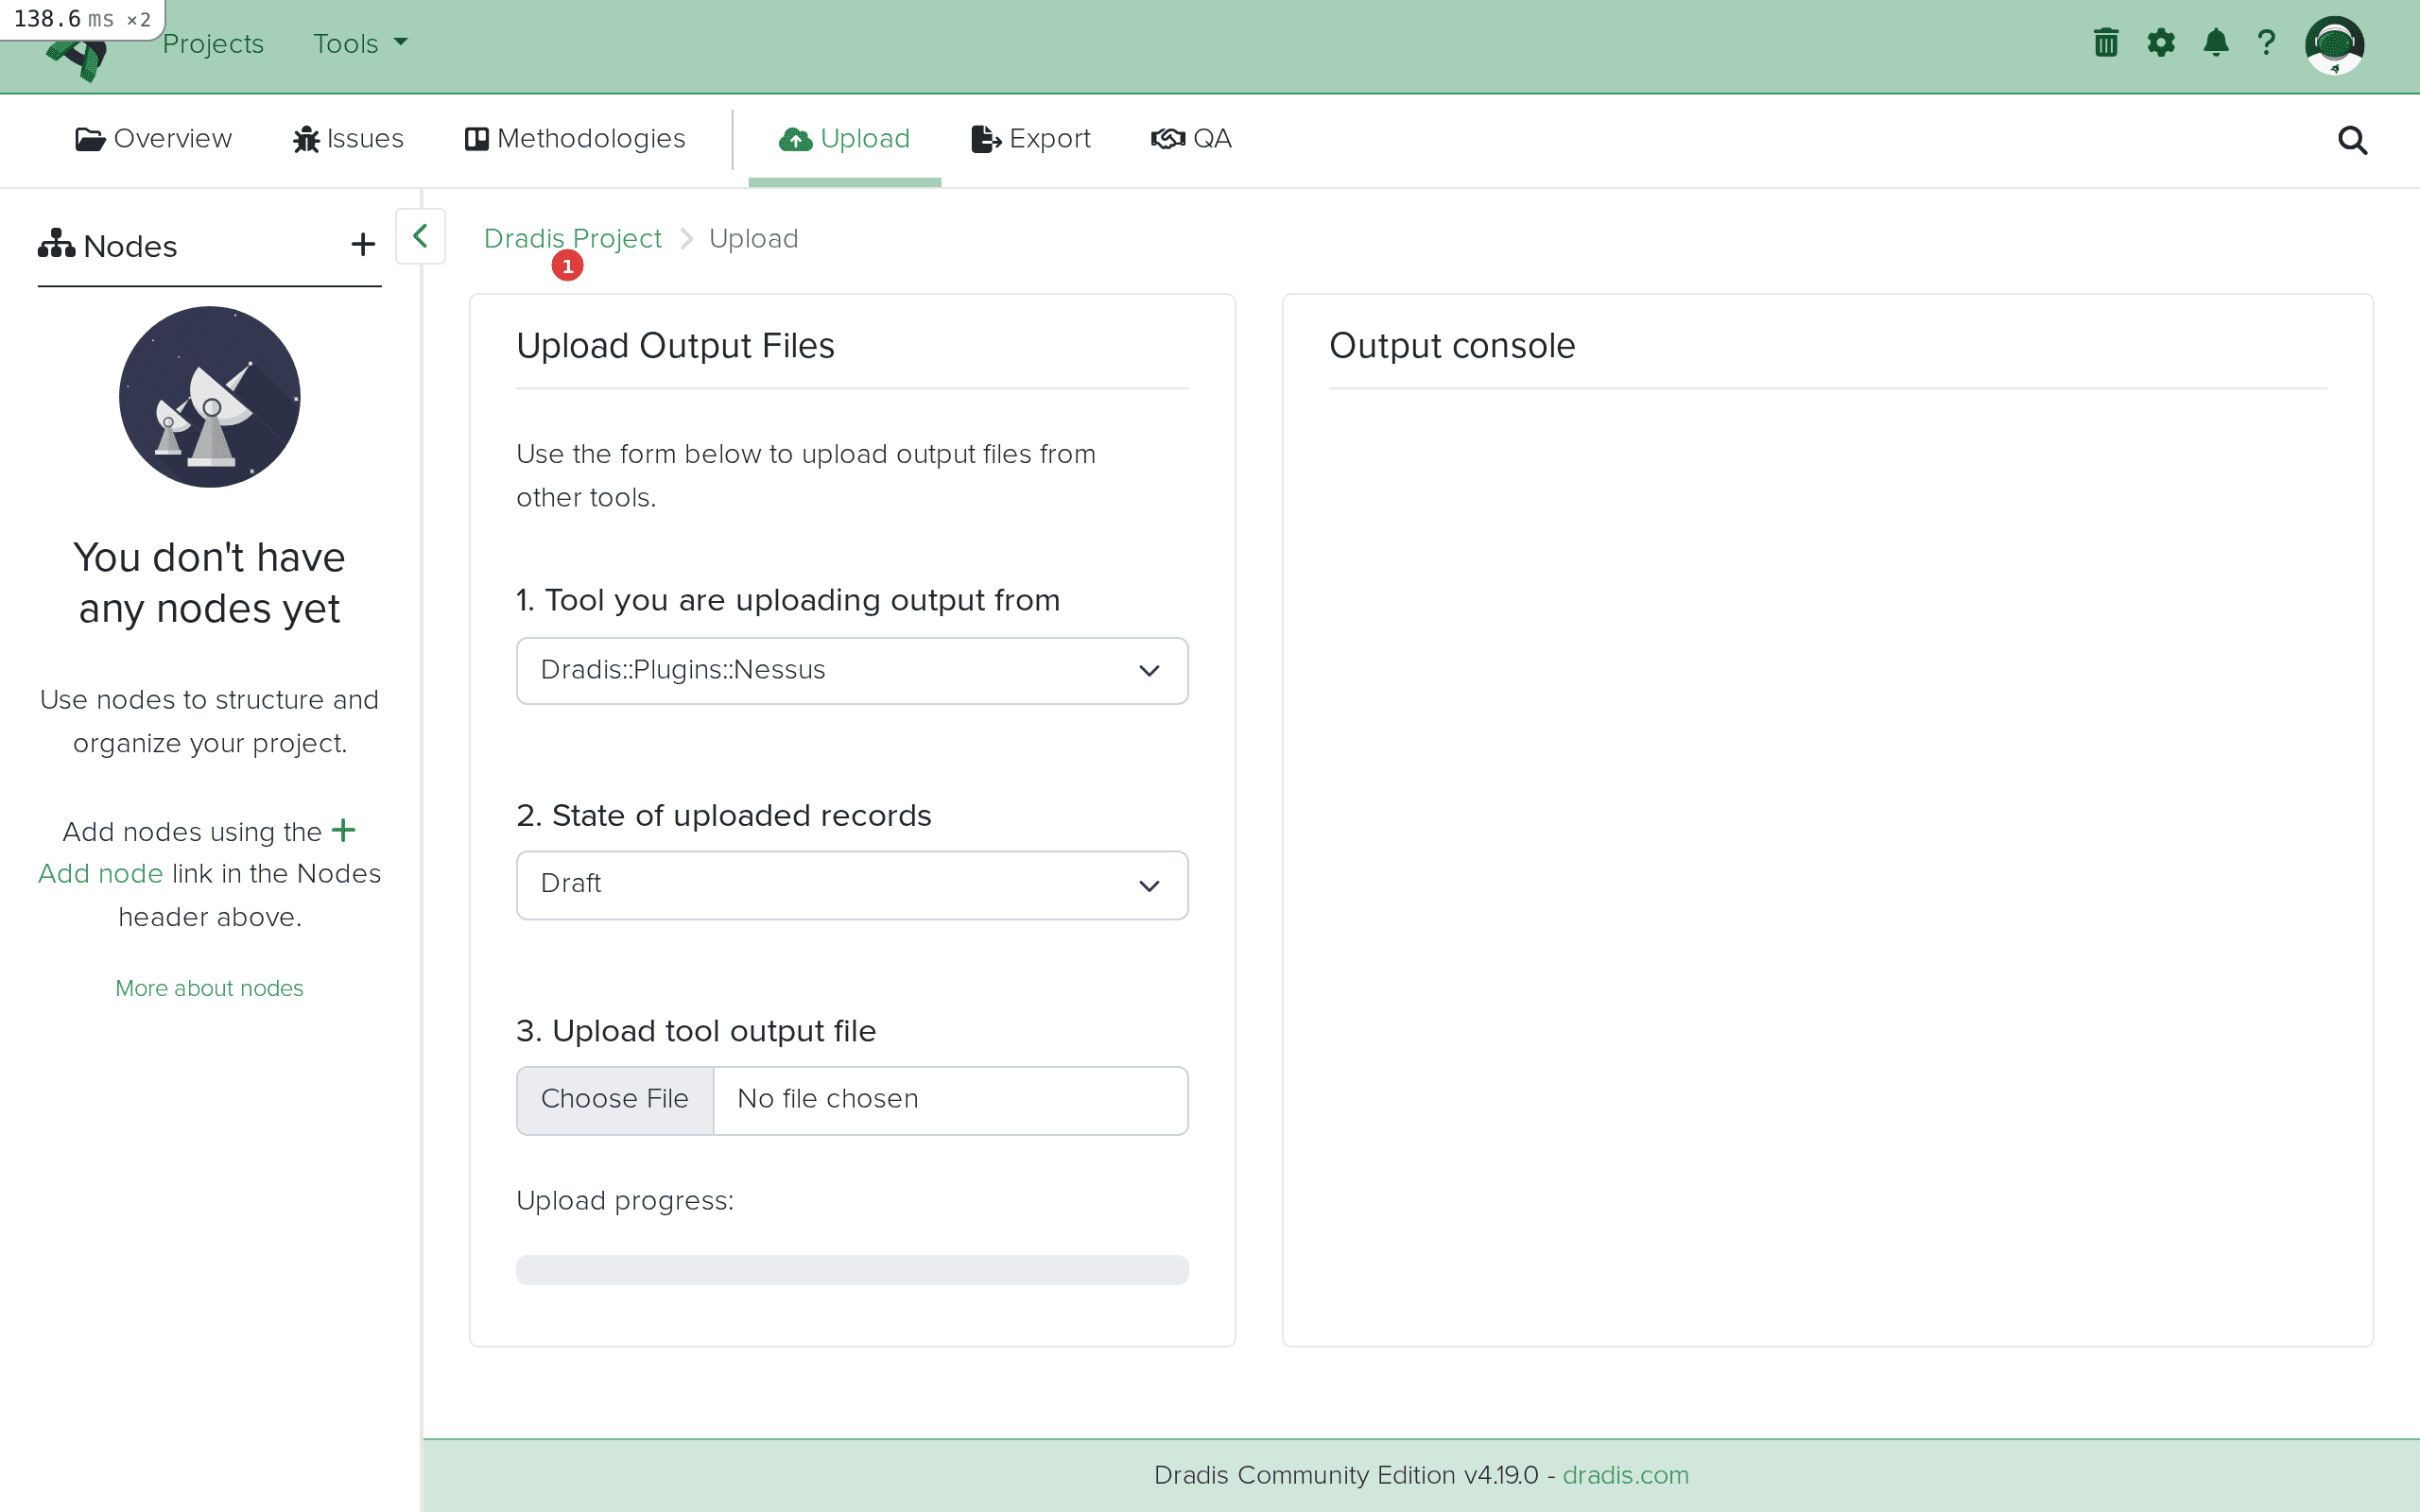 Dradis::Plugins::Nessus selected and ready for file upload.
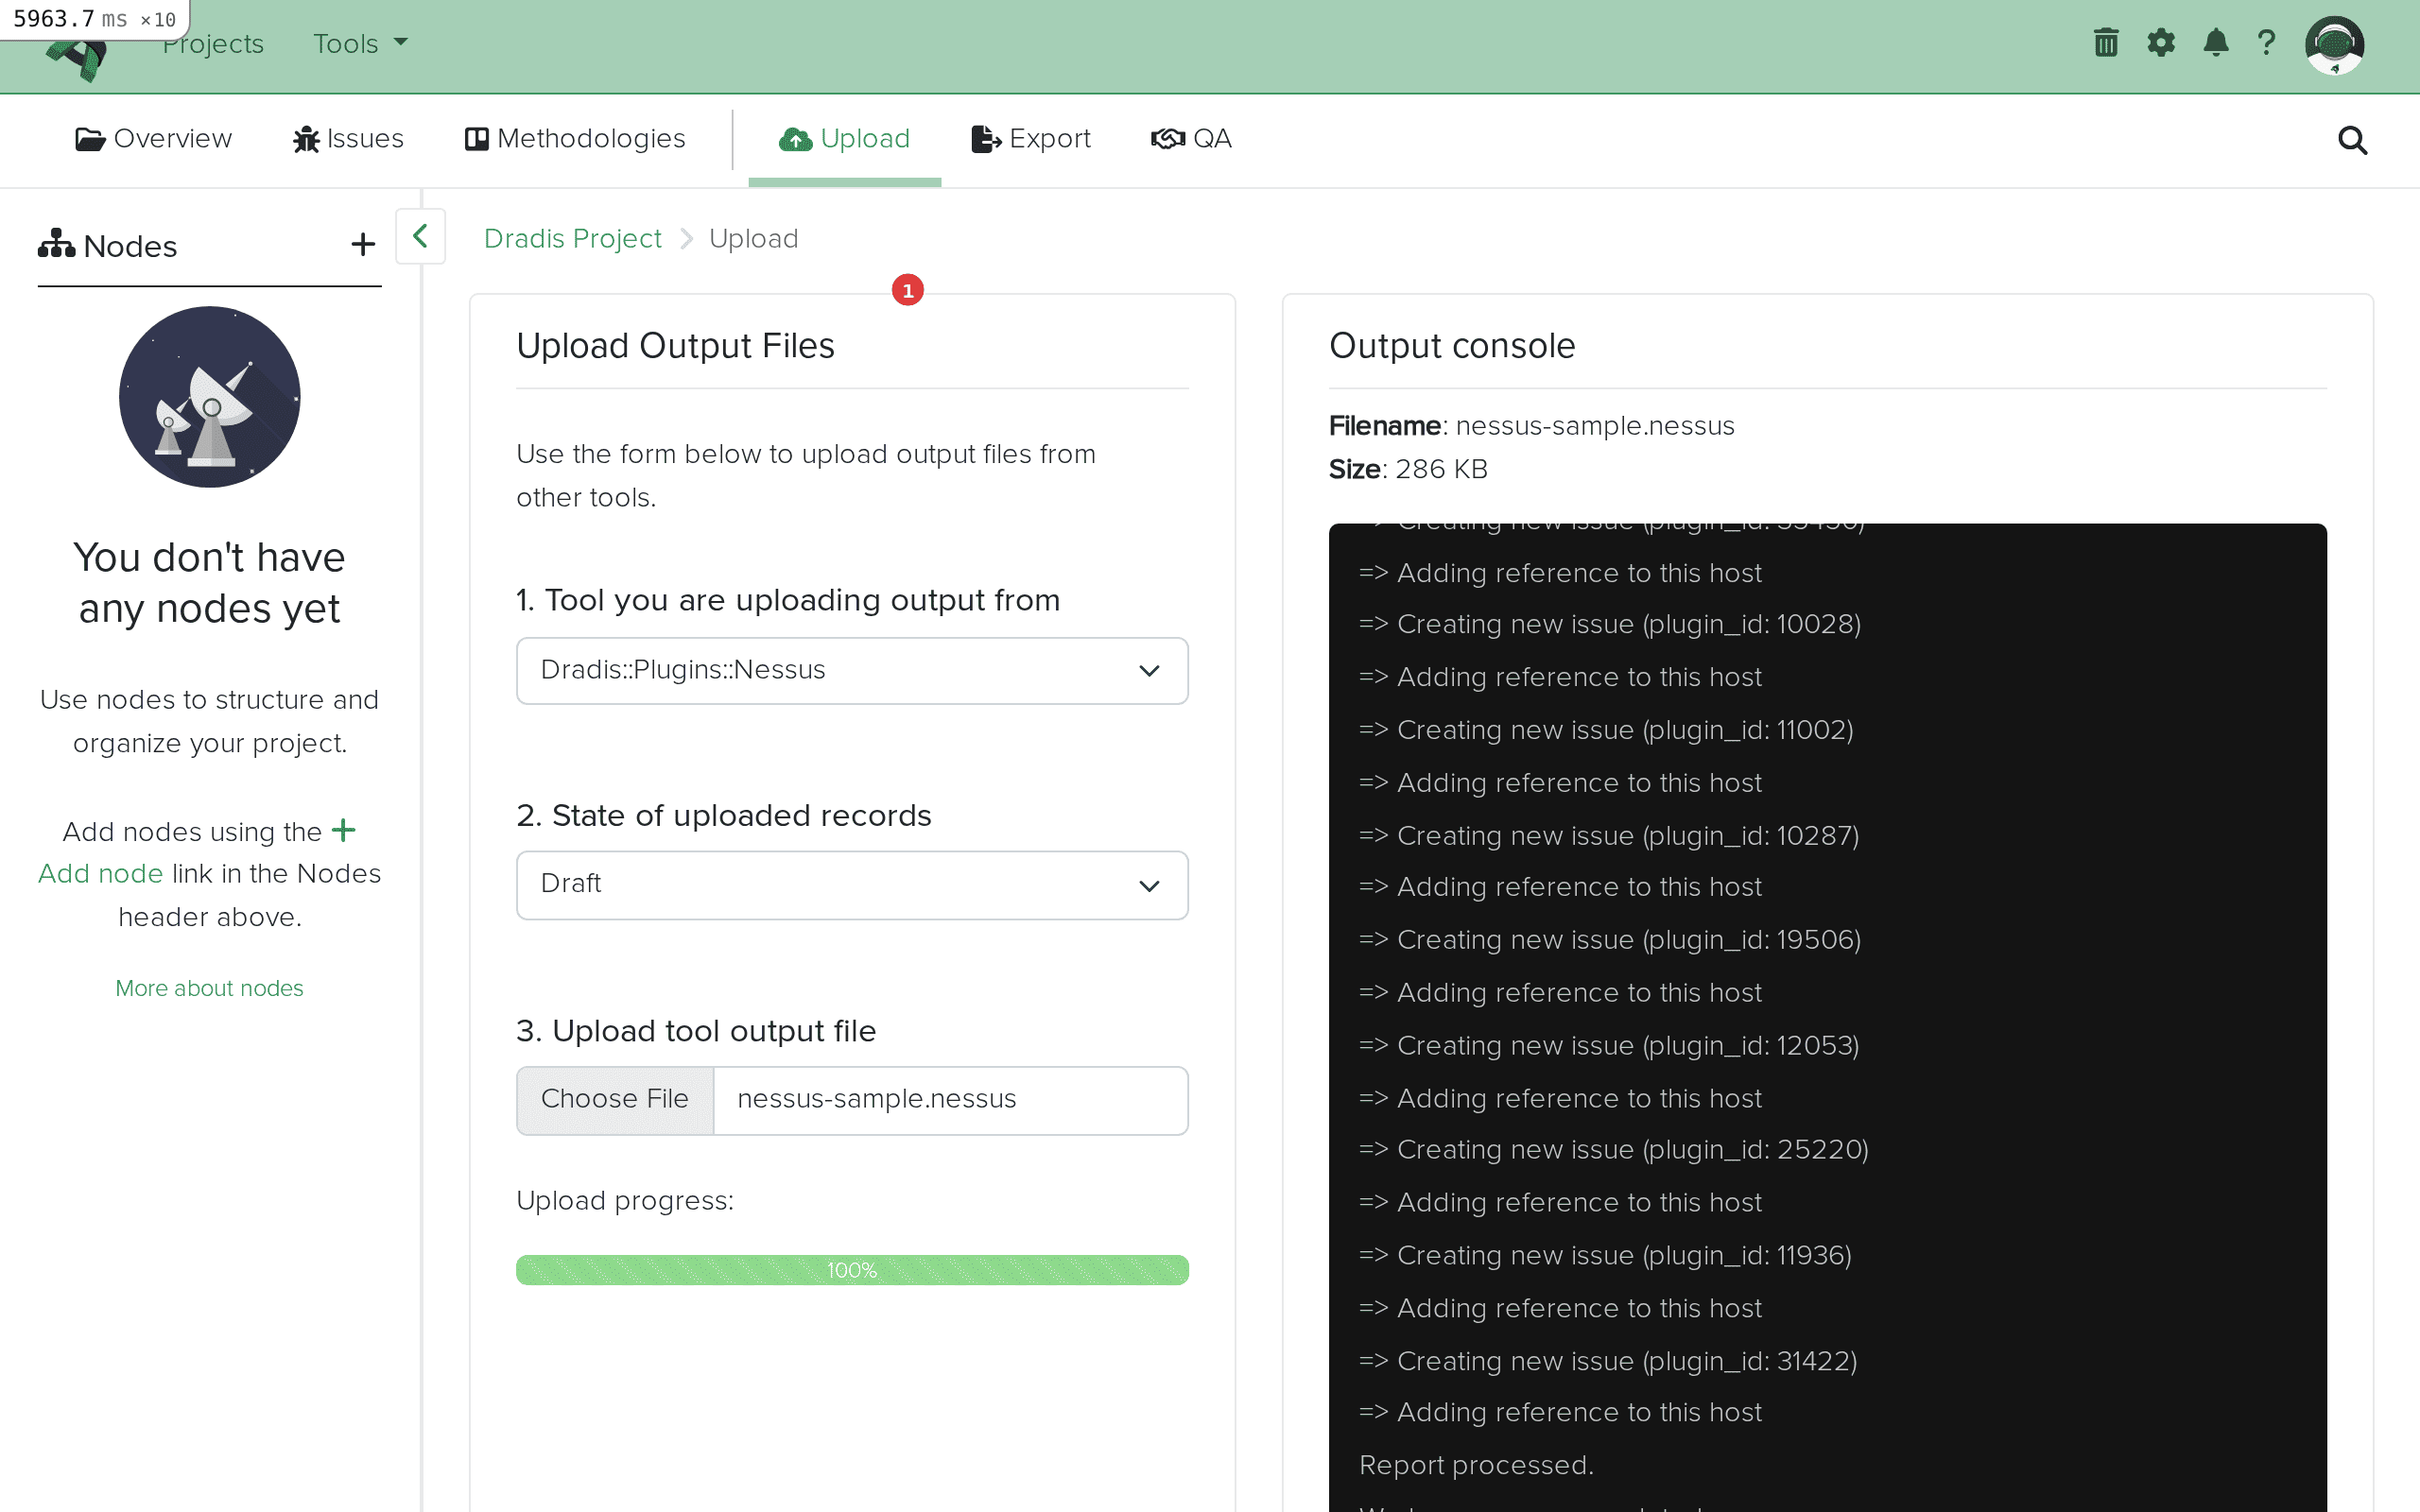
Click Choose File and select your .nessus file. The upload begins automatically once the file is selected — there is no separate submit button. You'll see the filename and size appear in the Output console on the right.
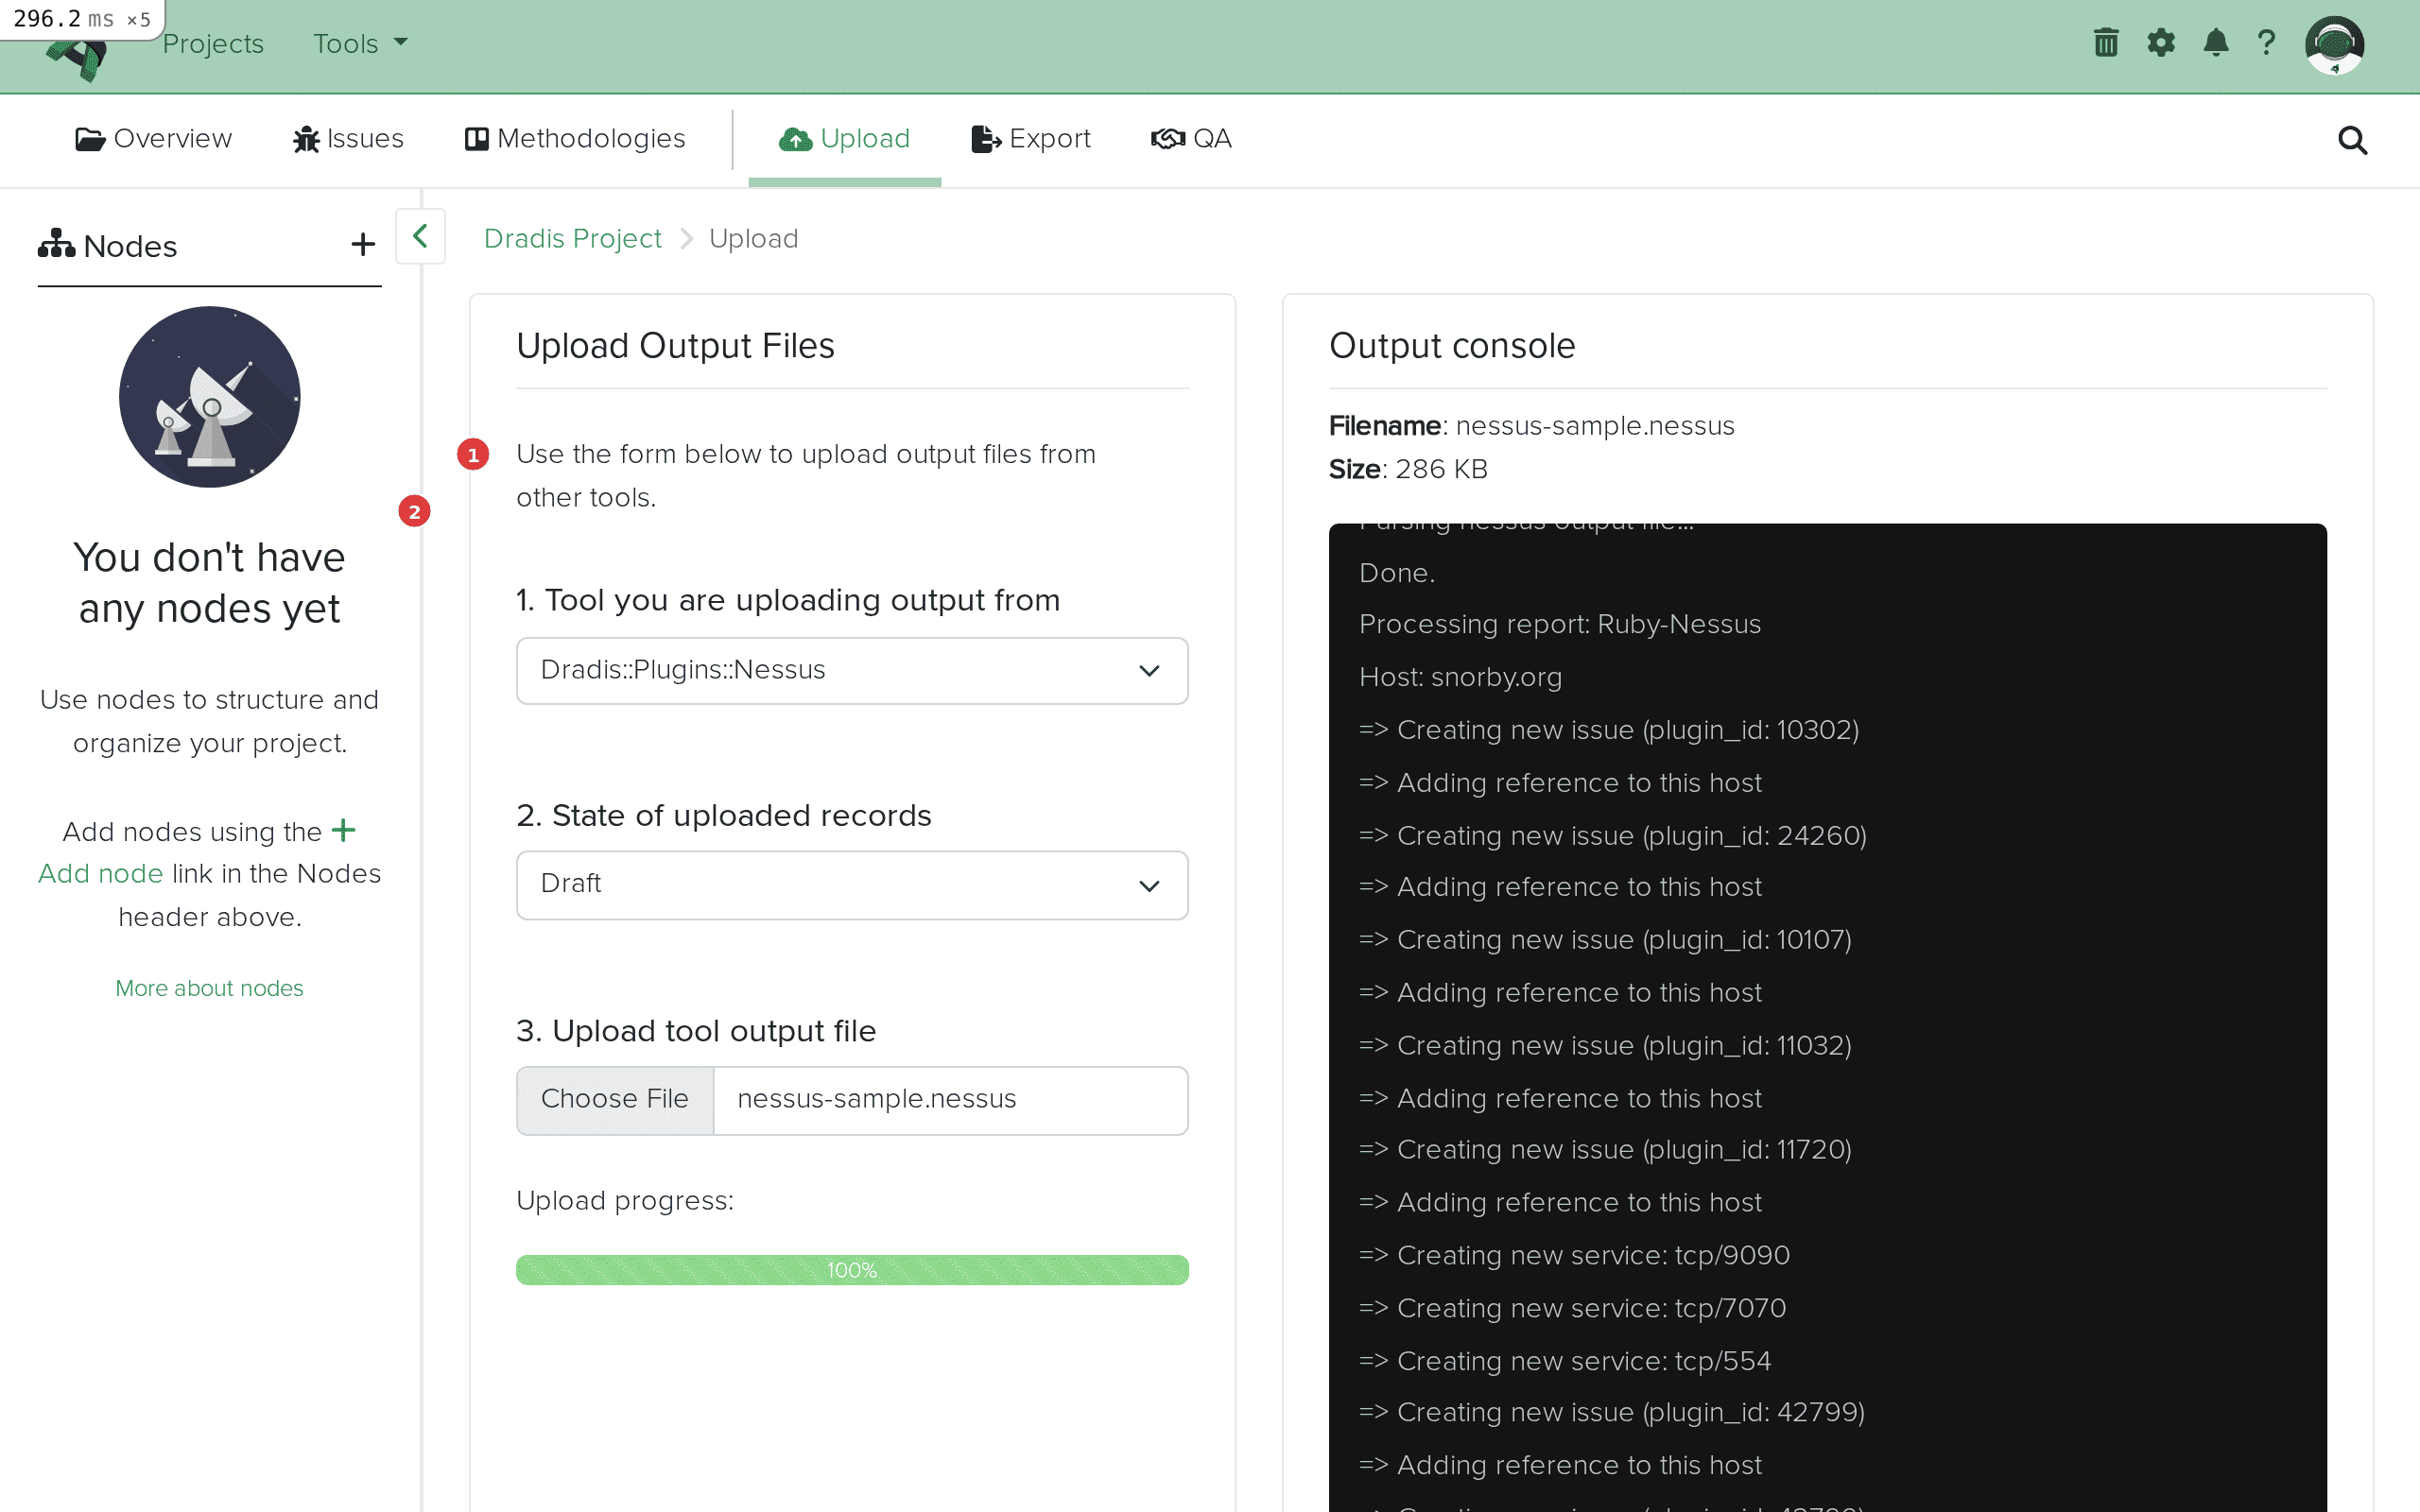 The file is uploading. The progress bar (1) shows upload status, and the Output console (2) will display the import log.
The Output console streams the import progress in real time. You'll see entries like:
Creating new issue (plugin_id: 51192)
Adding reference to this host
Creating new issue (plugin_id: 10287)
Adding reference to this host
...
Report processed.
Worker process completed.
Each "Creating new issue" line means a new Nessus plugin was encountered for the first time. "Adding reference to this host" means Evidence was created linking an existing Issue to the current host.
 Import complete. The Output console (1) shows all created issues and host references. "Worker process completed" confirms a successful import.
Click the Issues tab to see all imported Nessus findings. Each unique Nessus plugin becomes one Issue, displayed with its title, affected hosts, tags, and state.
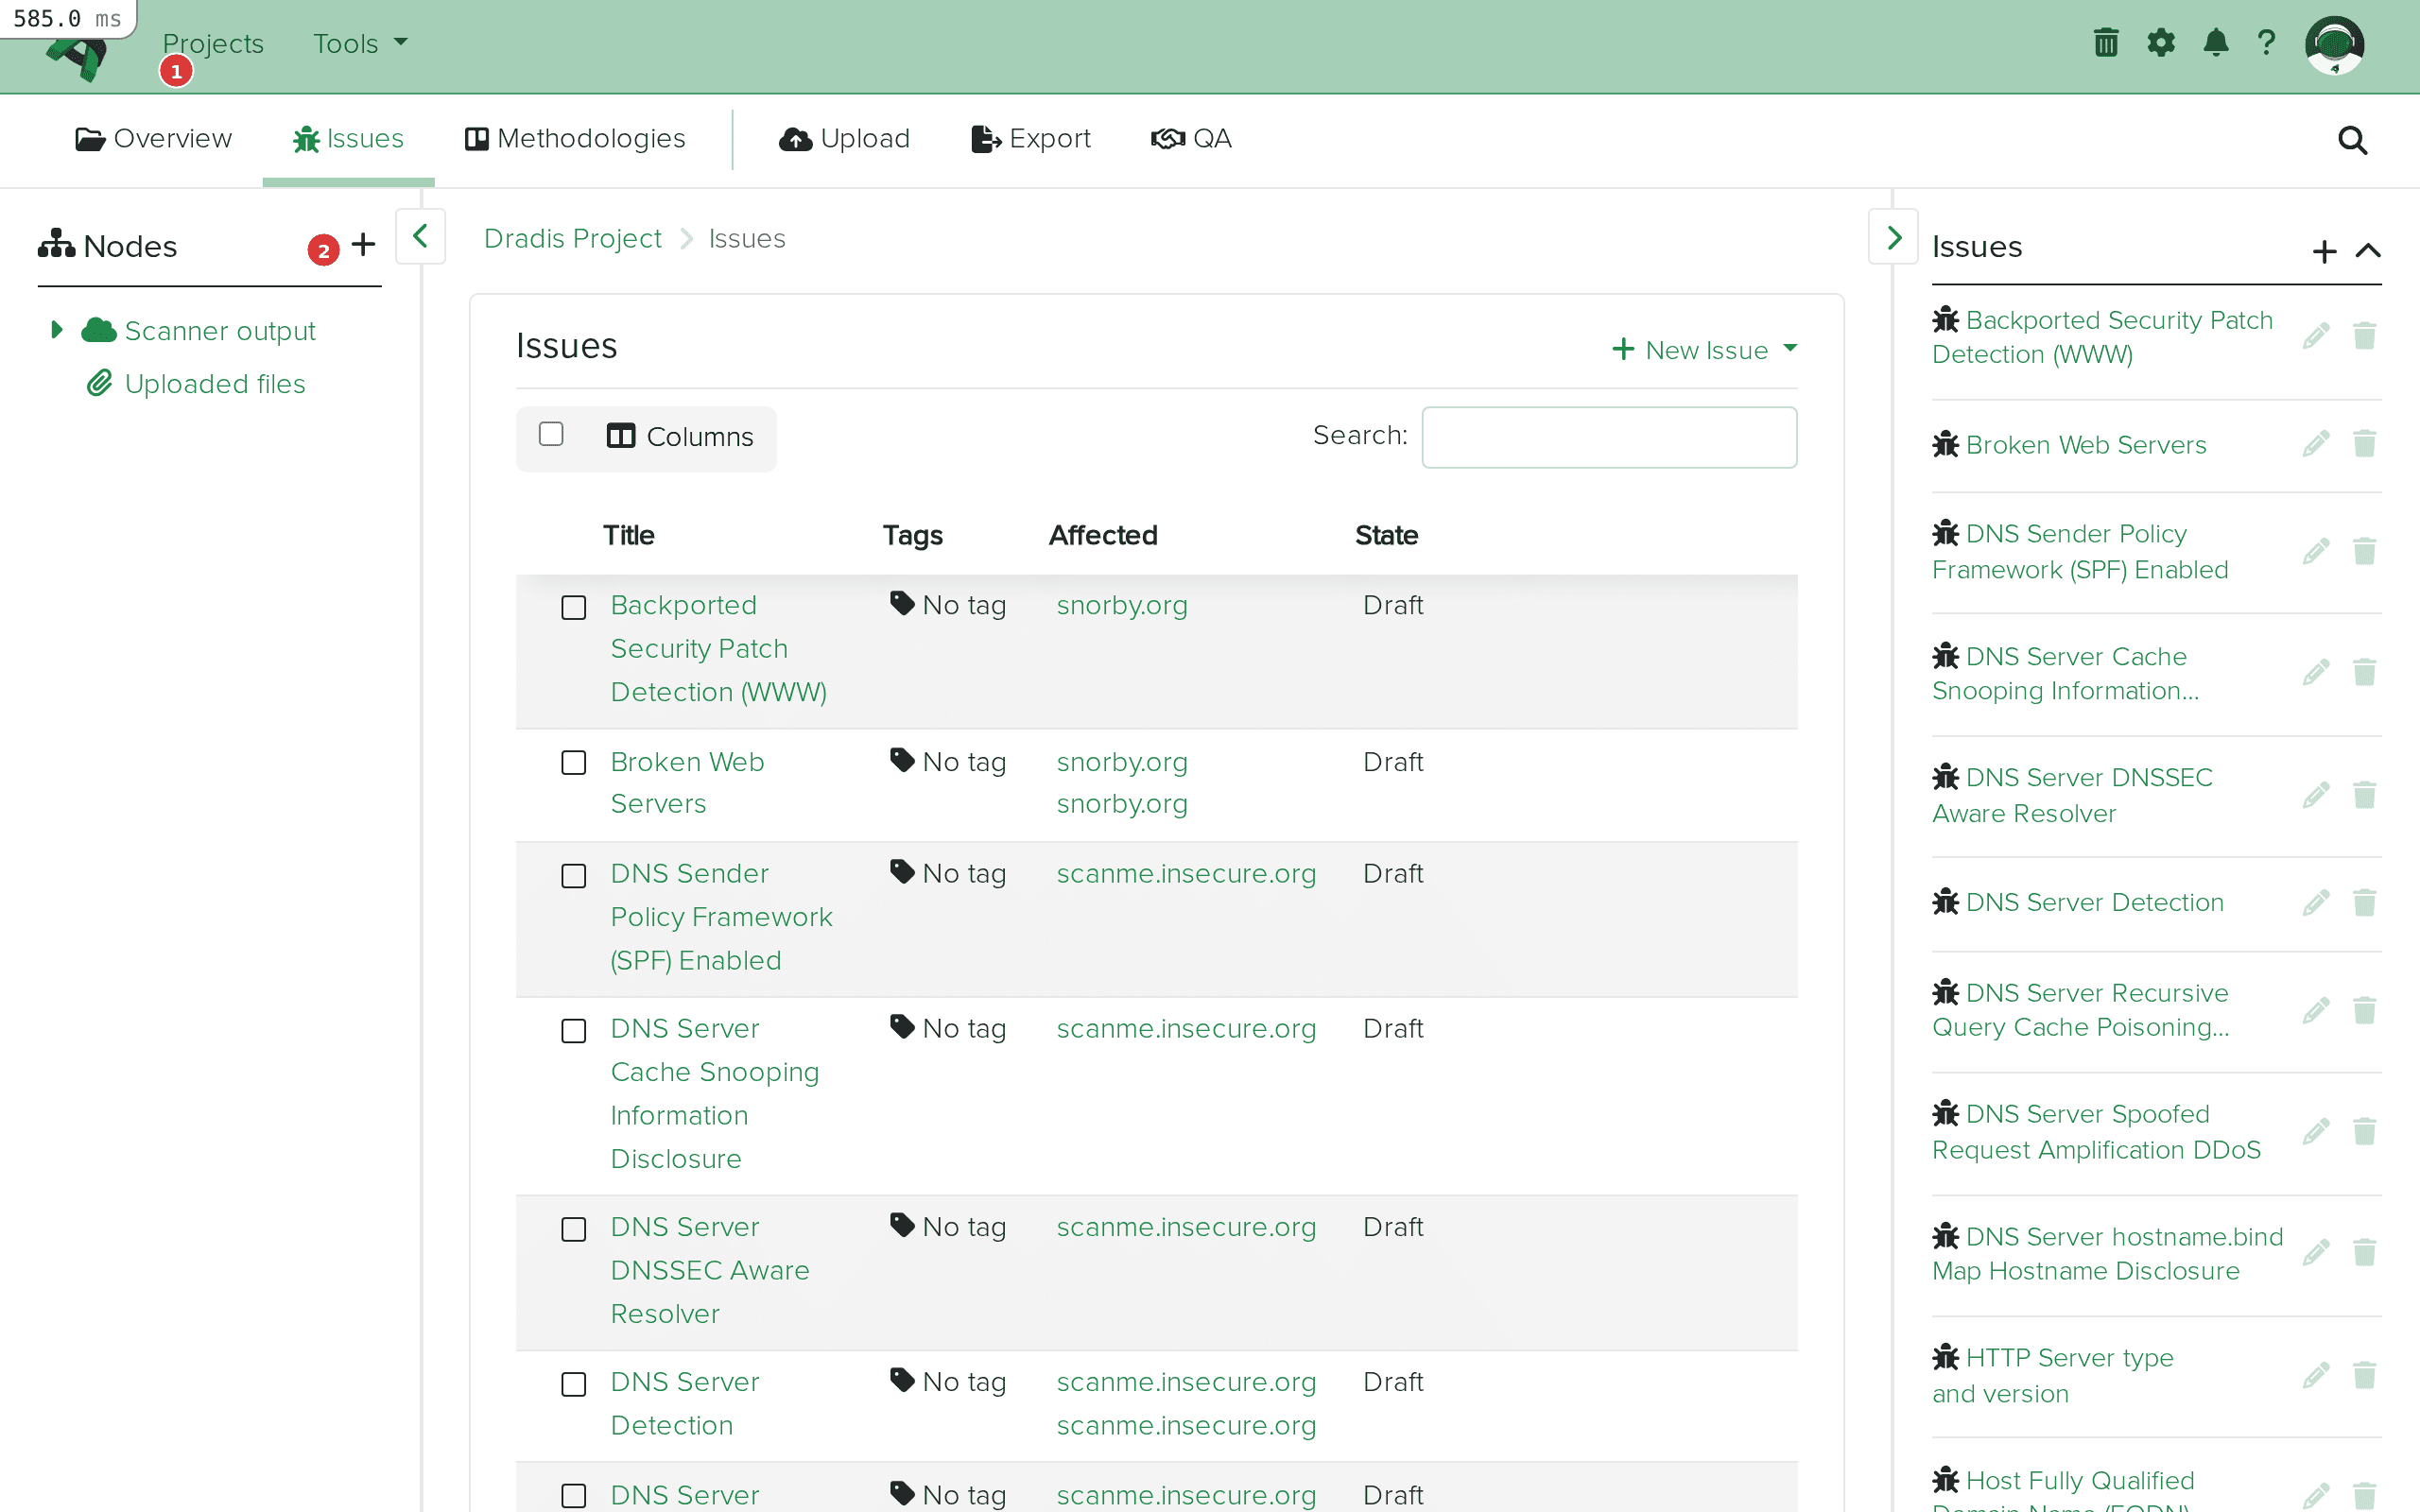 The Issues tab (1) shows all imported findings. The table (2) displays each issue with its title, affected hosts, and state.
Click any Issue to see its full detail view. The fields map directly from the Nessus plugin data: Title from pluginName, Description from <description>, Solution from <solution>, and CVSS scores from the corresponding XML elements.
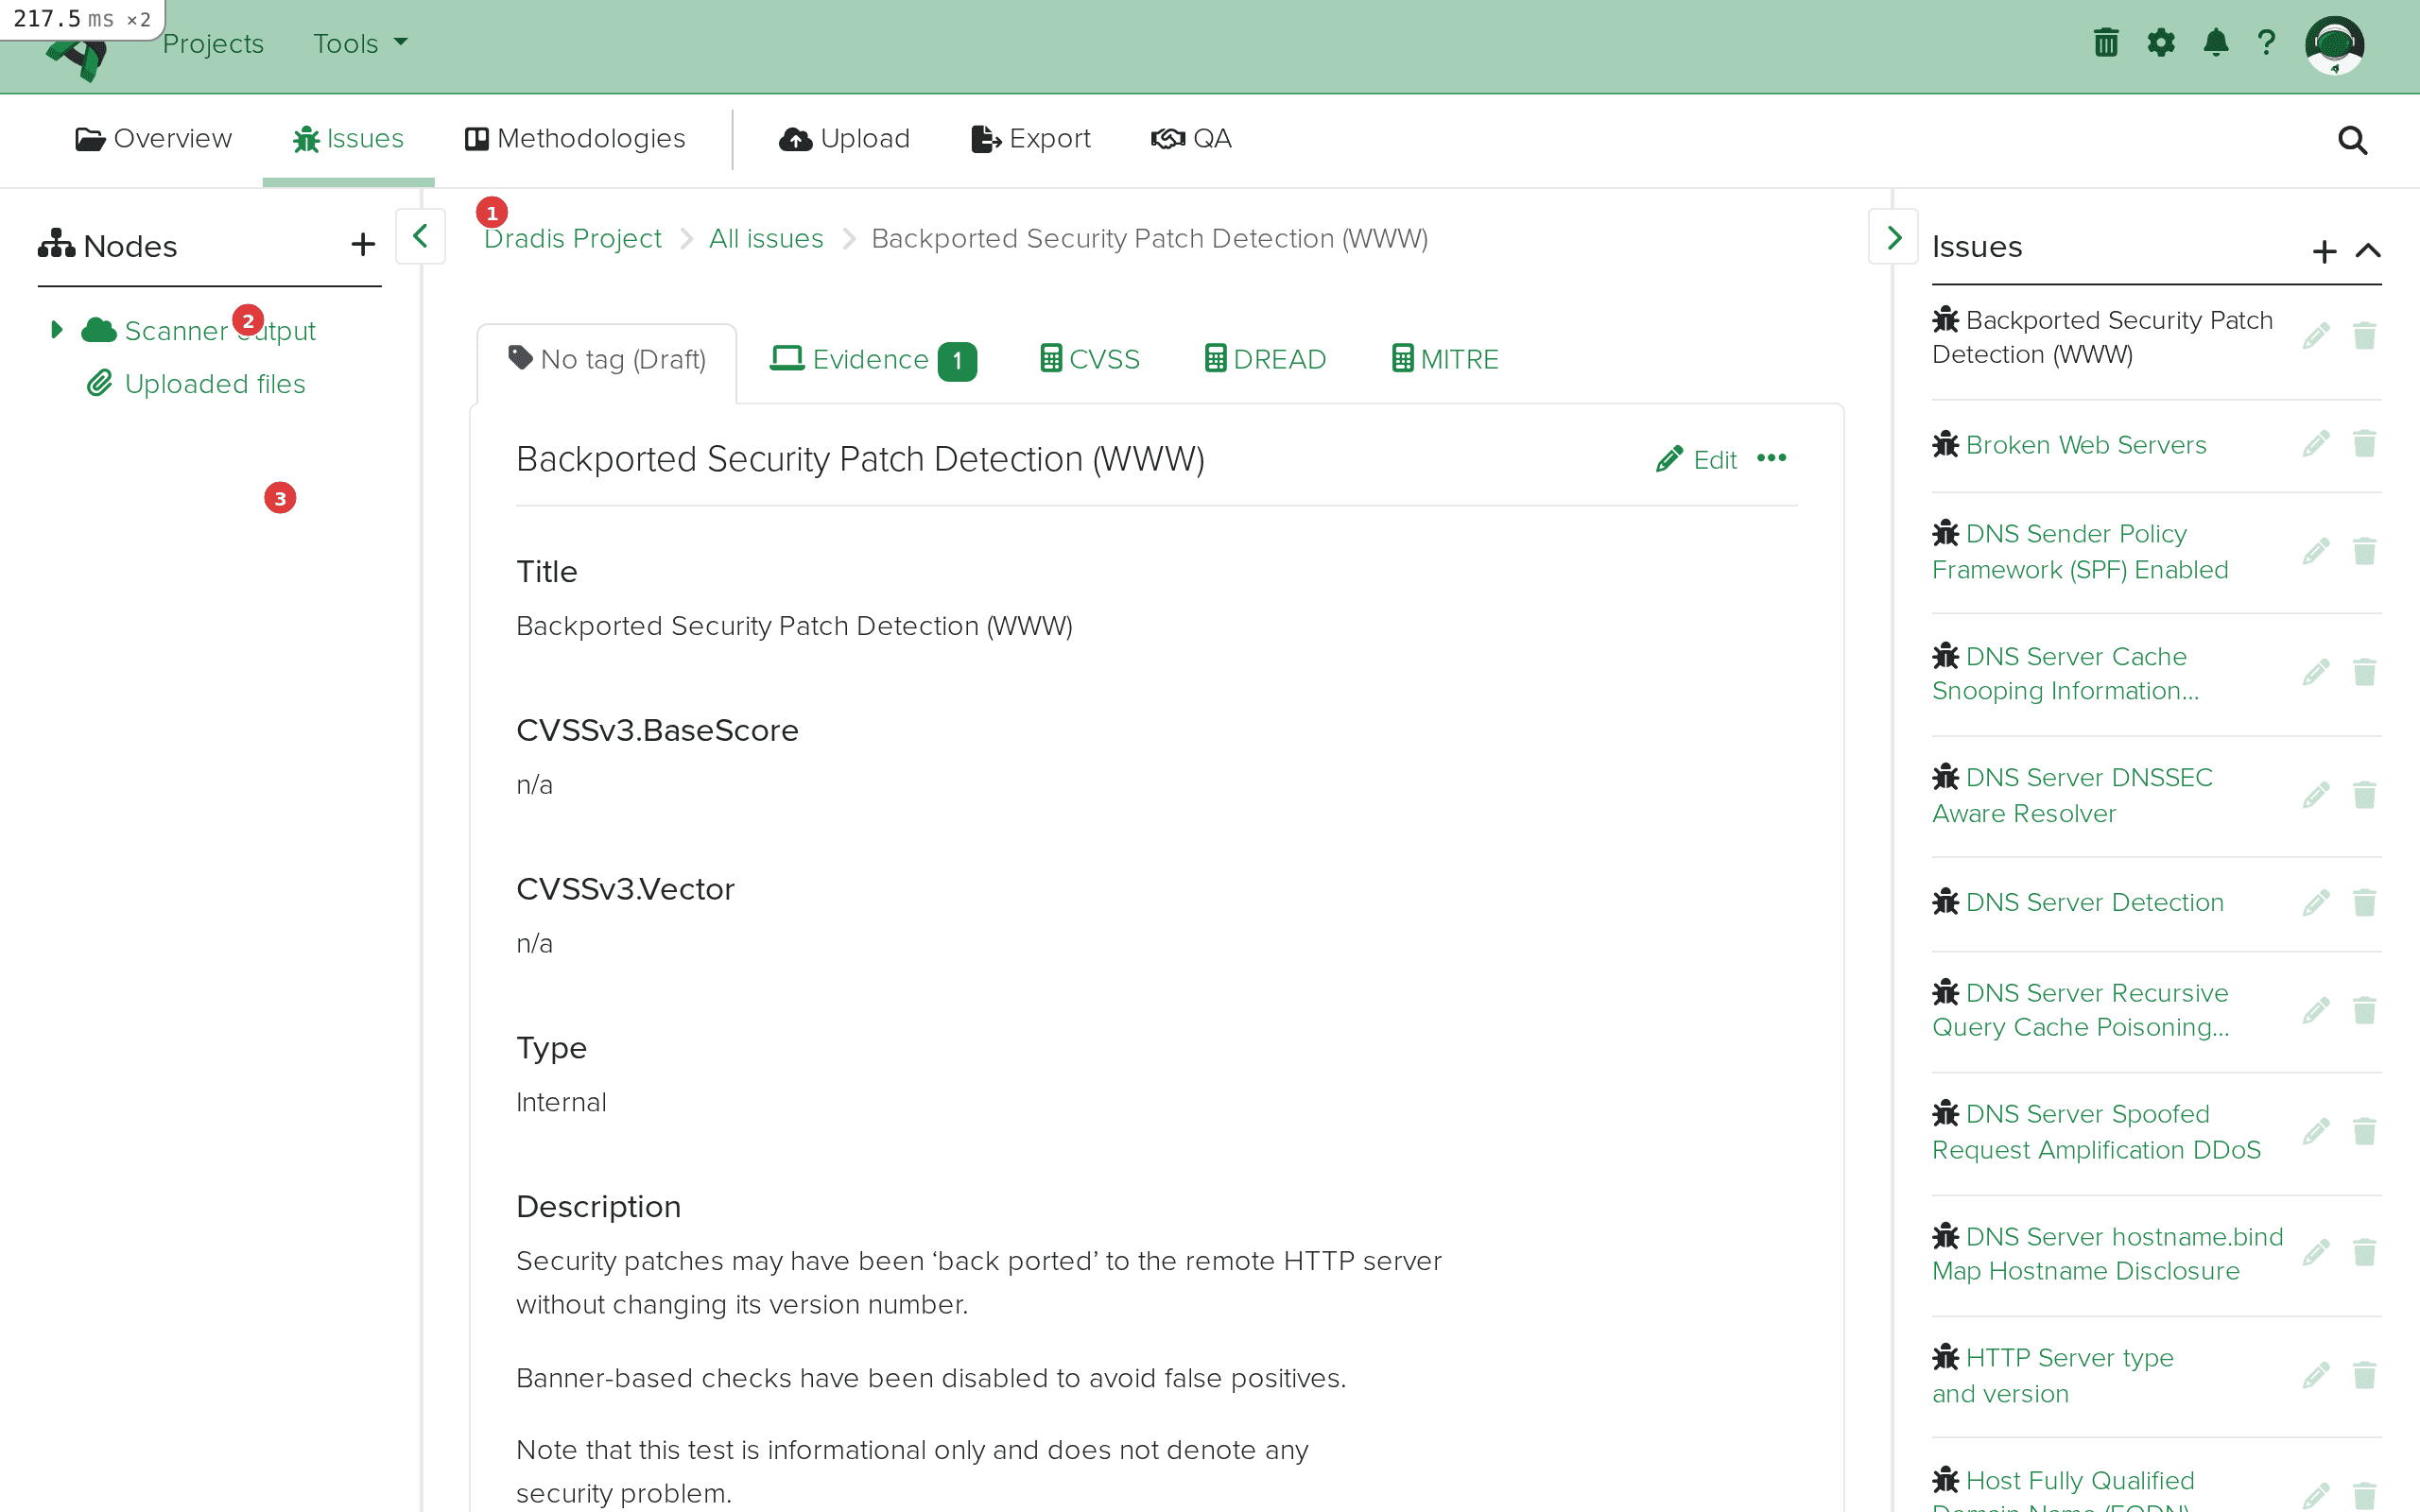 Issue detail view. The breadcrumb (1) shows navigation context. The sidebar (2) lists all issues for quick switching. The main content area (3) displays the imported fields: Title, CVSSv3 scores, Type, and Description.
Navigate back to the project overview or expand the Scanner output node in the sidebar. Each host from the Nessus scan appears as a child node — in this example, scanme.insecure.org and snorby.org.
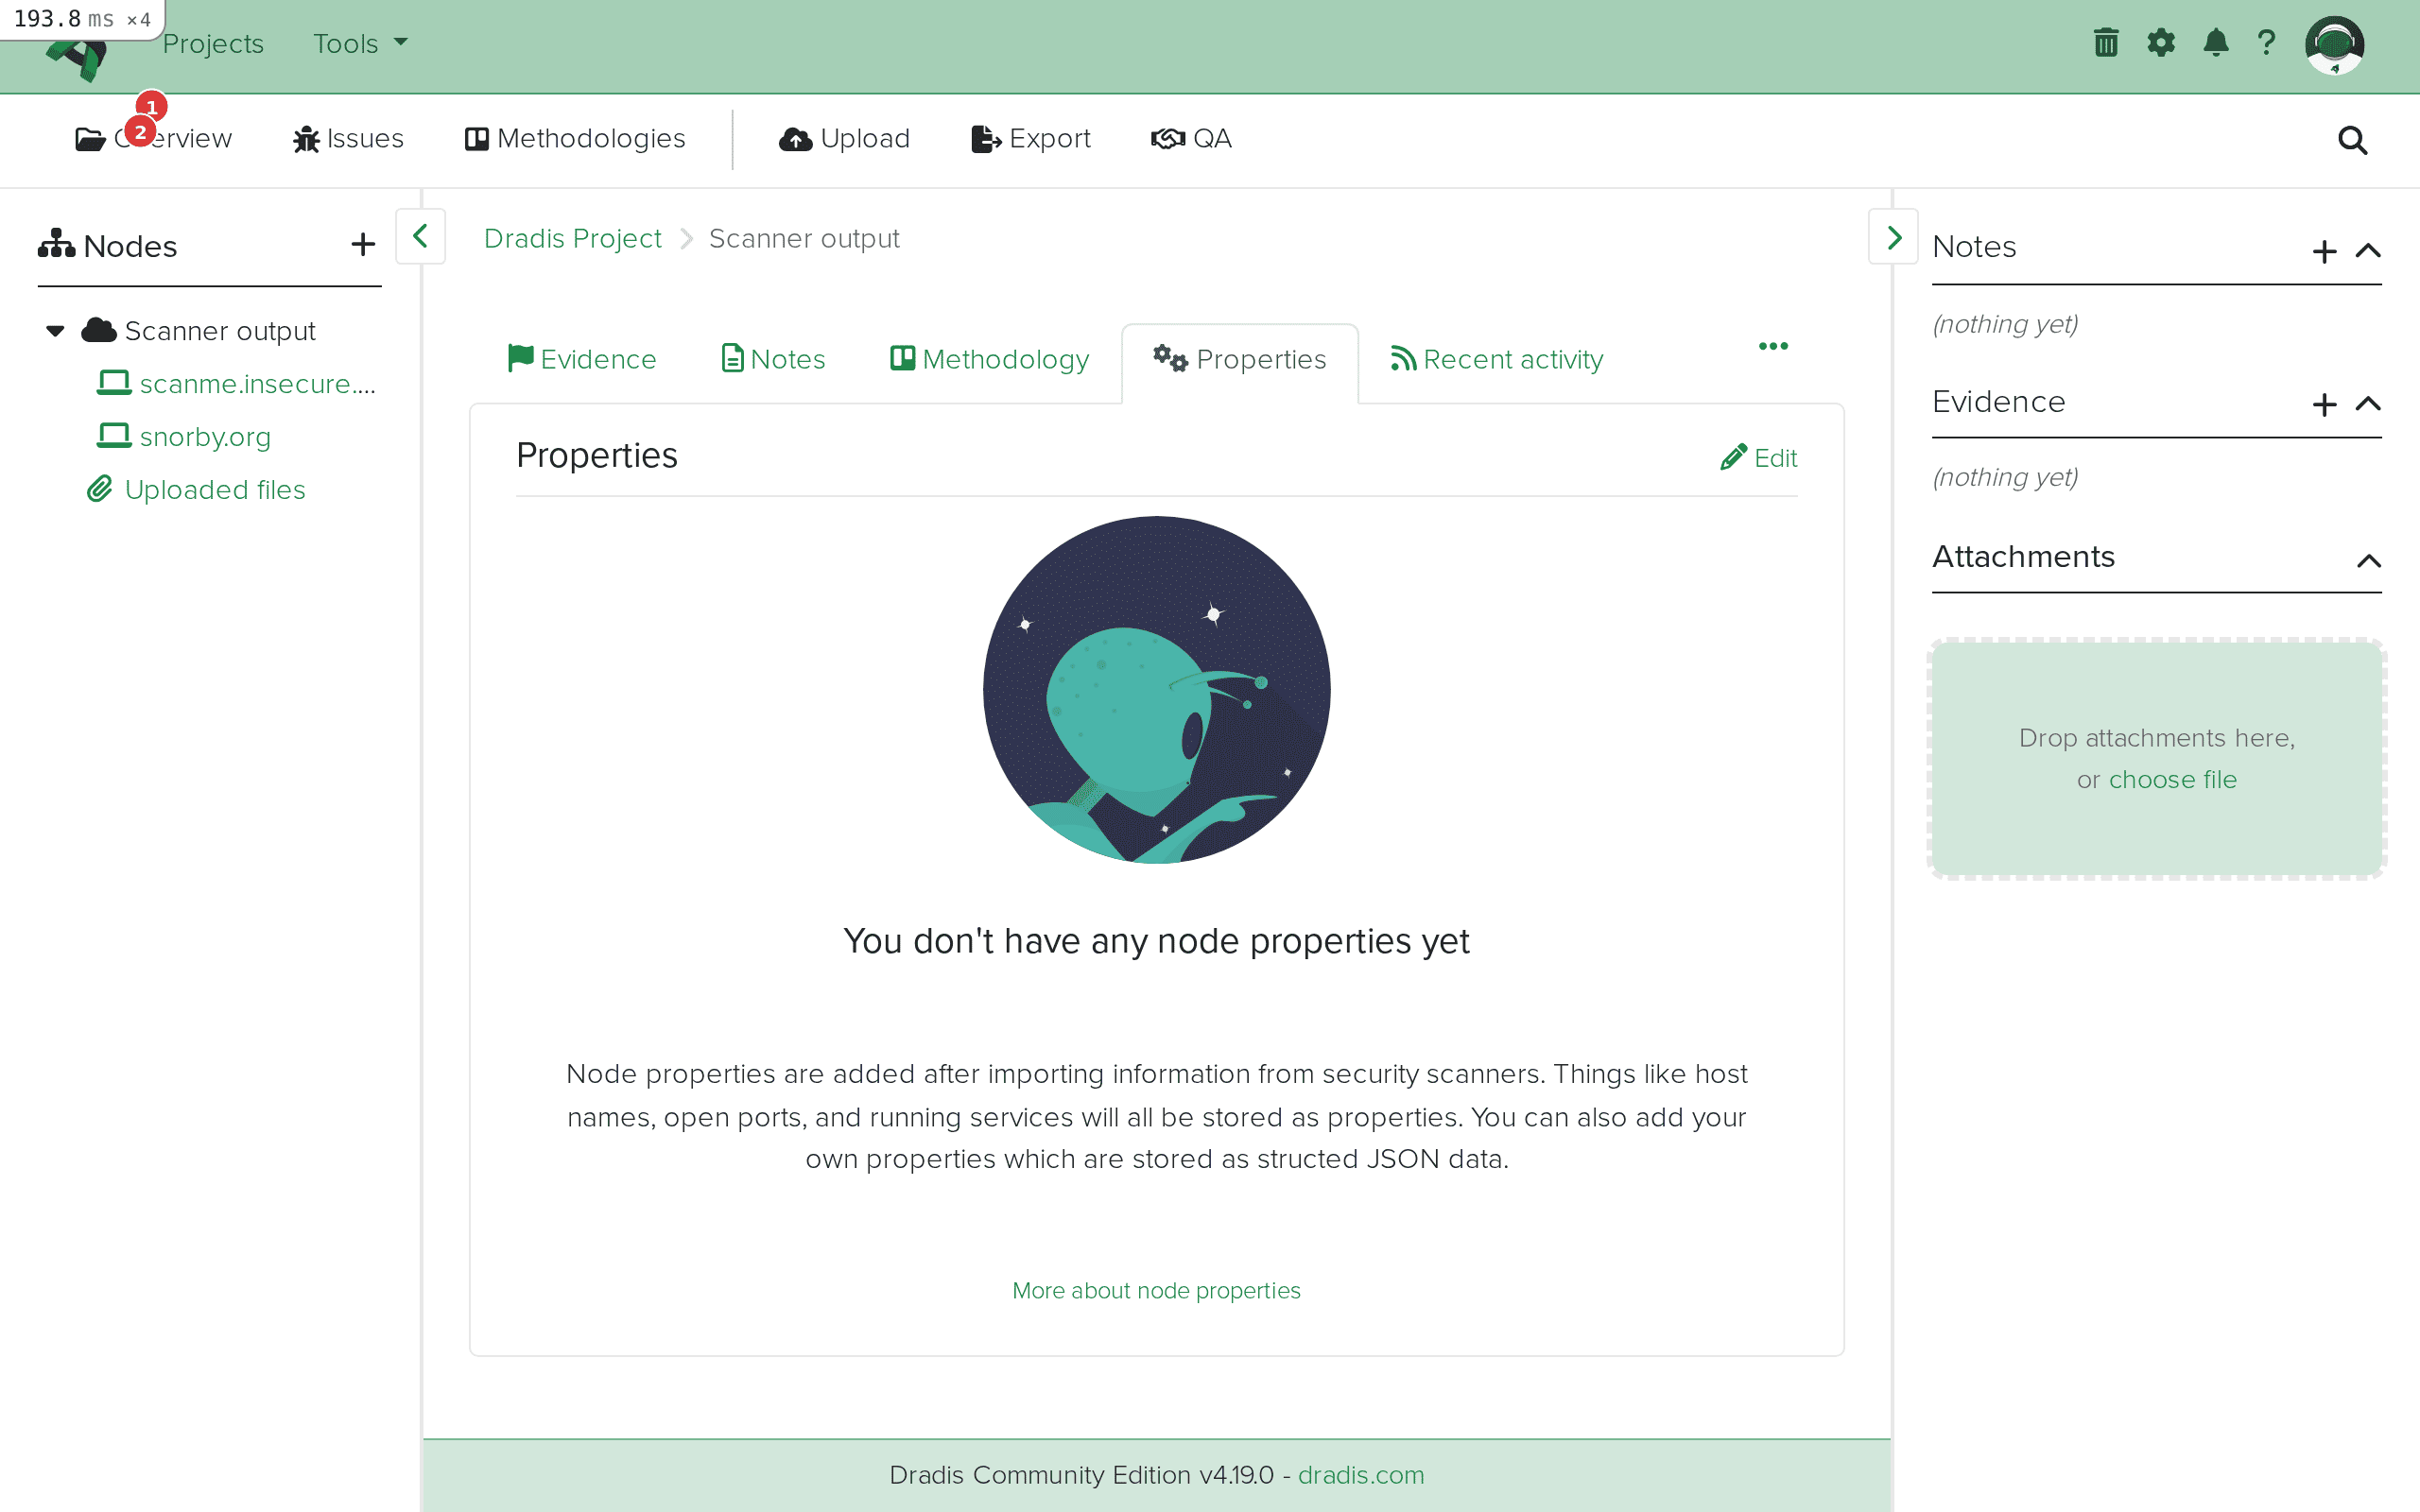 The sidebar node tree (1) shows the Scanner output parent with individual host nodes (2) for each scanned target.
Click a host node and select the Evidence tab to see all findings linked to that specific host. Each Evidence entry shows the Issue title, the host label, and the port/protocol combination where the finding was detected.
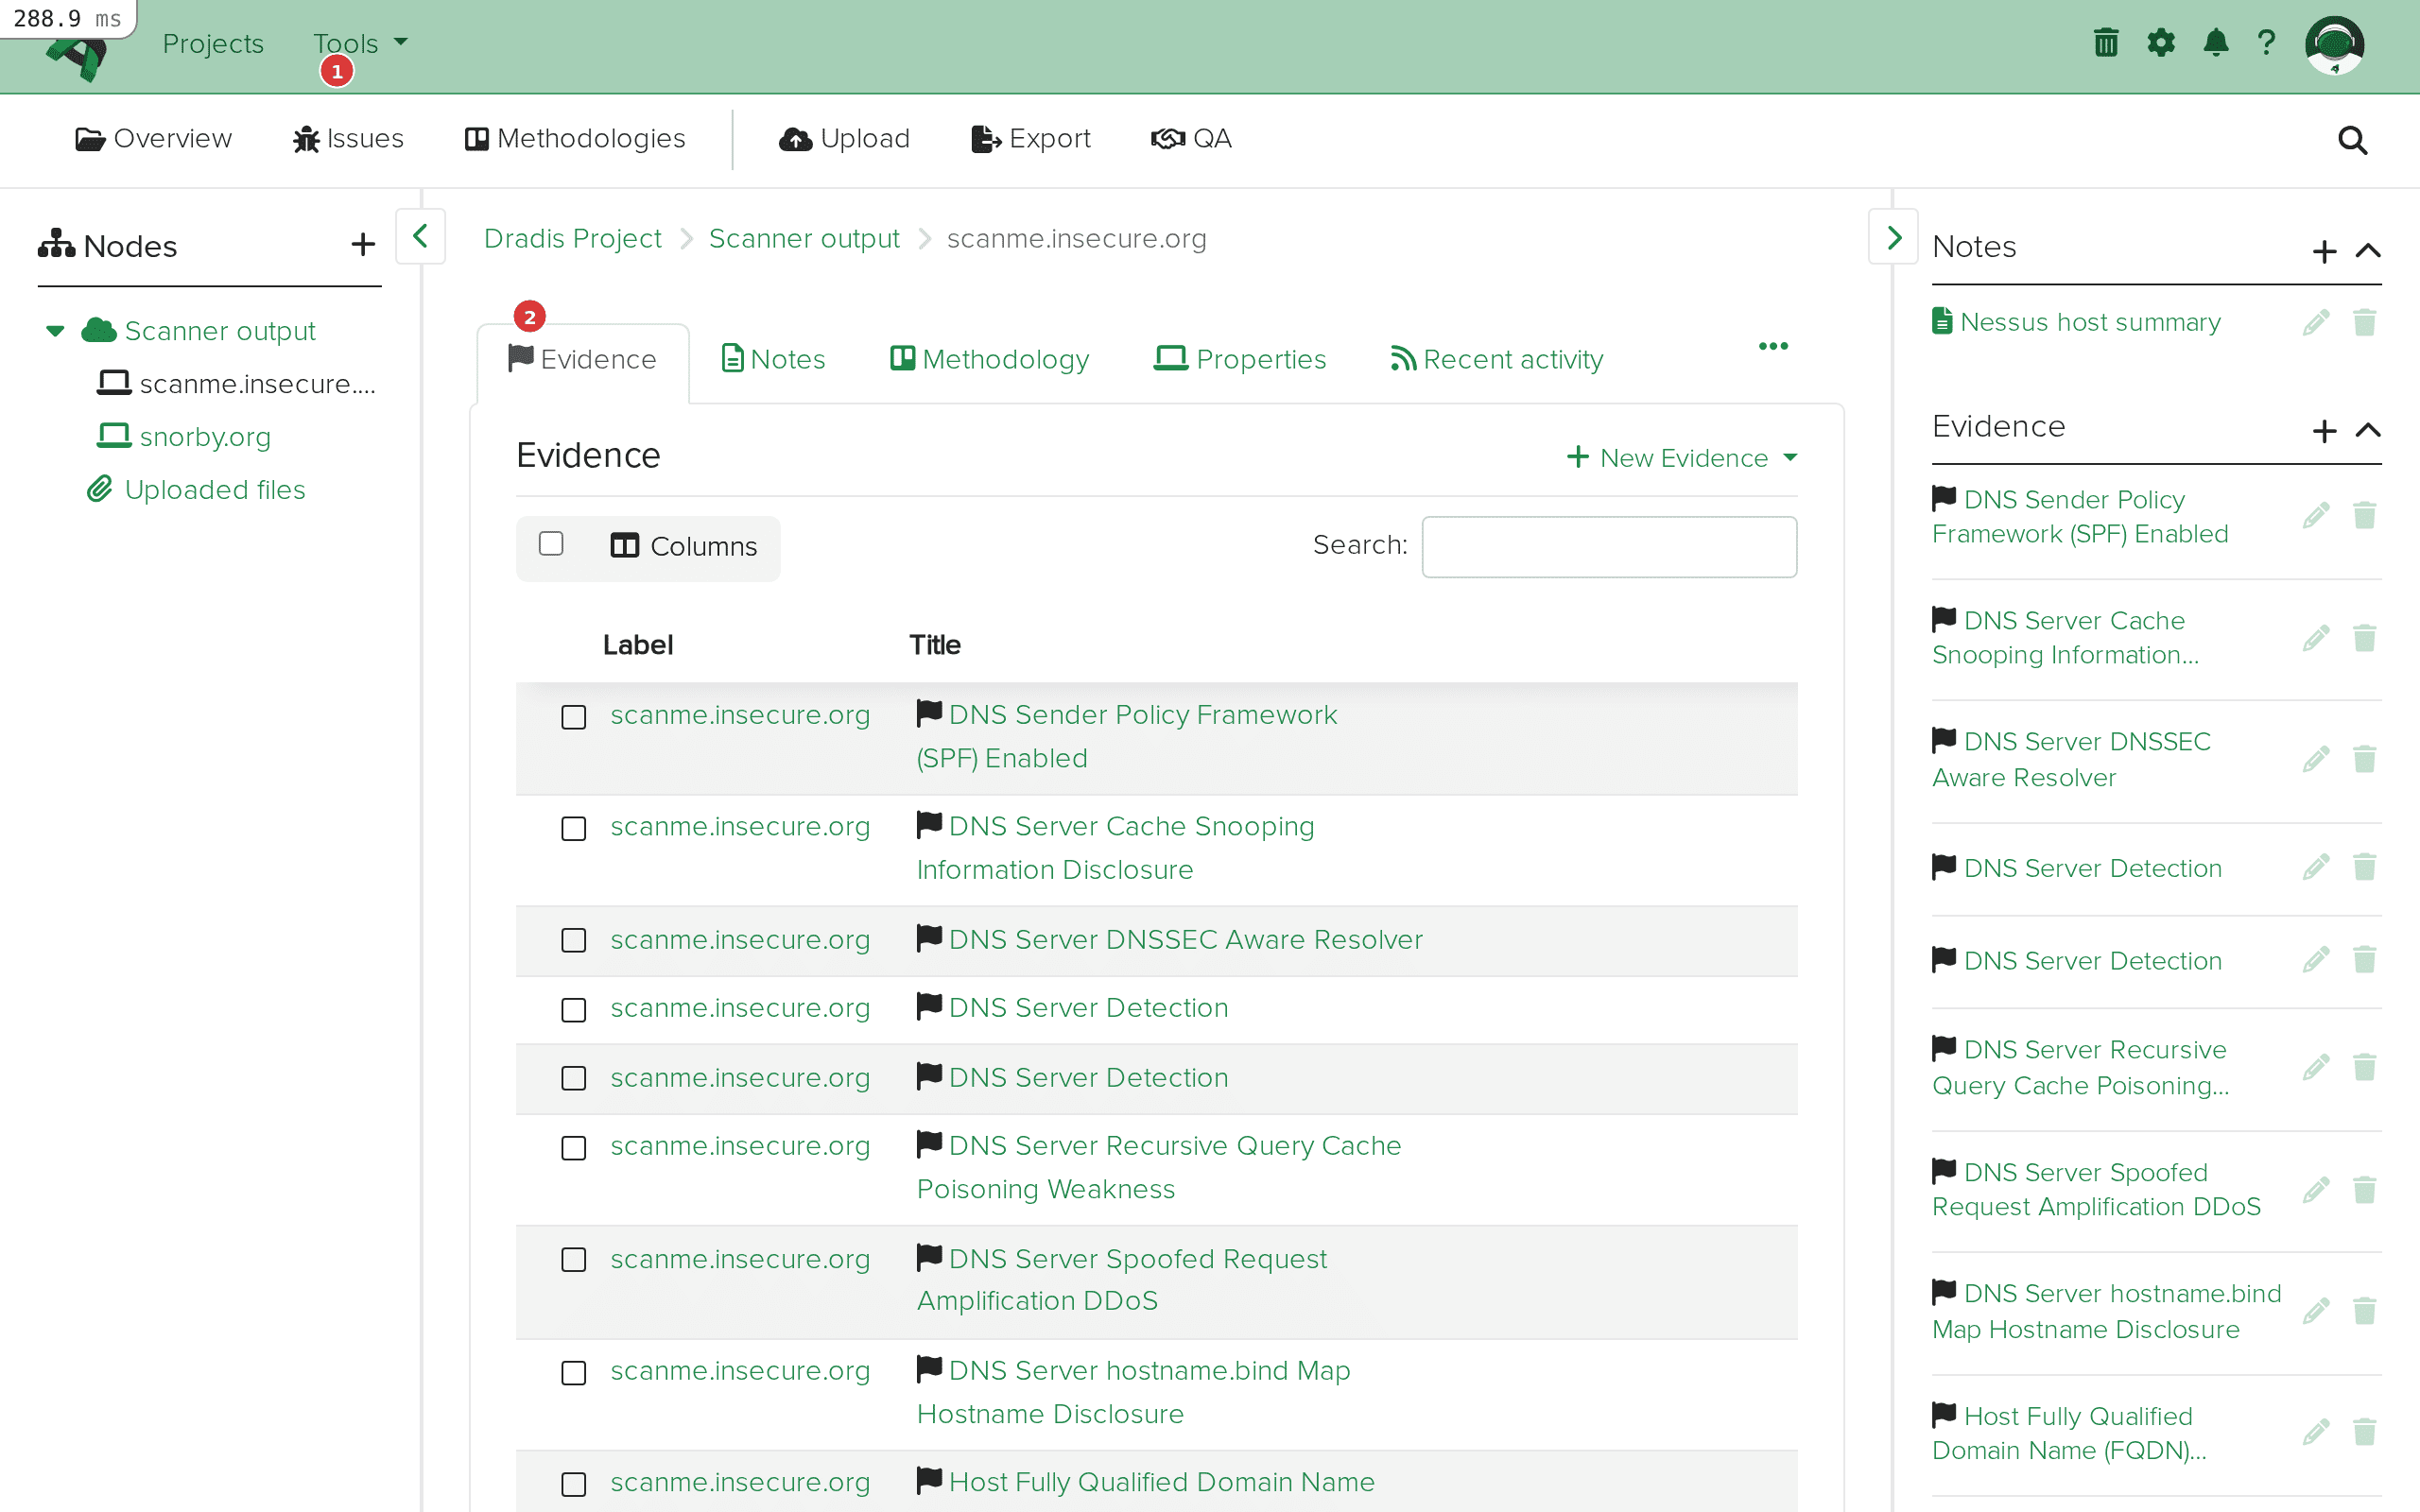 The Evidence tab (1) for scanme.insecure.org lists every finding detected on that host, with the Issue title (2) and affected location.
Nessus often detects the same vulnerability on multiple hosts and ports. Dradis handles this intelligently: the first time a pluginID is encountered during import, it creates an Issue. For every subsequent occurrence (on a different host or port), it creates only Evidence linking back to that same Issue. This means if Nessus finds "SSL Certificate Cannot Be Trusted" on 50 hosts, you get one Issue with 50 Evidence entries — not 50 duplicate issues cluttering your project.
Nessus provides vulnerability and compliance data, but its service detection is secondary to its vulnerability checks. Import an Nmap scan of the same targets into the same Dradis project to get detailed service banners, OS fingerprinting, and port state information alongside your Nessus vulnerabilities. The host nodes will merge: if both tools scanned 192.168.1.100, the node will contain Evidence from both Nessus and Nmap under the same host.
If your .nessus file includes compliance audit results (from Nessus Compliance Checks or SCAP audits), the Dradis plugin imports the cm:compliance-* fields as Evidence. You can access compliance-specific data like compliance.cm_result (PASSED/FAILED), compliance.cm_policy_value (expected value), and compliance.cm_actual_value (what was found on the host). In Dradis Pro, use the Mappings Manager to create a custom Evidence template that surfaces these compliance fields prominently.
Nessus scans typically include many informational plugins (severity 0) like "Nessus Scan Information" (plugin 19506) and "Nessus SYN Scanner" (plugin 11219). The Dradis plugin automatically skips certain special plugins — plugin ID 0 (empty placeholders), 11219 (SYN Scanner), 34220 (Netstat Portscanner), and 22964 (Service Detection) — which are converted to node services instead of issues. However, other informational plugins will still be imported. If you want a cleaner import, filter your Nessus export to exclude severity 0 plugins before uploading to Dradis.
Tenable's Vulnerability Priority Rating (VPR) is available via the report_item.vpr_score field. VPR incorporates threat intelligence and exploit maturity beyond what CVSS provides. In Dradis Pro, you can use the Rules Engine to automatically tag or categorize issues based on their VPR score — for example, auto-tagging anything with VPR >= 7.0 as "Critical Priority" to focus your remediation recommendations.
This usually means the plugin selection was wrong. Verify you selected Dradis::Plugins::Nessus (not another plugin). Also check that your file is actually in .nessus XML v2 format — if you exported as CSV or HTML from Nessus, the plugin cannot parse it. Open the file in a text editor and confirm it starts with <?xml and contains <NessusClientData_v2>.
If your scan produced hundreds of findings but only a handful imported, the file may be truncated or corrupted. Re-export from Nessus and verify the file ends with </NessusClientData_v2>. Also check the Output console log for parsing errors — the plugin will skip malformed <ReportItem> elements and continue processing the rest of the file.
If you see a Ruby error in the Output console, the .nessus file may contain XML elements the plugin doesn't expect. This can happen with very old Nessus versions (v1 format) or files that have been manually edited. Ensure you're using Nessus XML v2 format (any Nessus 6.x or later produces this format by default).
For very large .nessus files (100MB+, thousands of hosts), the import may take several minutes. The Dradis worker processes the file synchronously. If the import appears stuck, check the Dradis server logs (log/development.log or log/production.log) for progress. For extremely large scans, consider splitting the Nessus export by host group or scan policy before importing.
The n/a value appears when a Nessus plugin doesn't include a particular XML element. For example, many older or informational plugins lack <cvss3_base_score> or <cvss3_vector>, so those fields display n/a. This is expected behavior — the plugin faithfully reports what Nessus provides. You can edit the Issue manually in Dradis to fill in missing values, or use the Mappings Manager (Pro) to remap fields to alternative sources.
| Feature | Community Edition | Professional |
|---|---|---|
| Nessus file import | Yes | Yes |
| Default field mapping | Fixed template | Customizable via Mappings Manager |
| Custom Issue/Evidence templates | No | Yes — remap any Nessus field to any Dradis field |
| Rules Engine | No | Yes — auto-tag, categorize, or assign issues by severity, VPR score, plugin family, etc. |
| Report generation with Nessus data | Manual (HTML export) | Automated Word/Excel reports with Nessus field placeholders |
| Integration with Jira/ServiceNow | No | Yes — push Nessus findings as remediation tickets |
| Multi-project Nessus imports | Manual per project | Project templates with pre-configured Nessus mappings |
The Mappings Manager in Pro is particularly valuable for Nessus imports because Nessus provides far more fields than the default template uses. You can build custom Issue templates that pull in VPR scores, exploit availability, CVE lists, patch dates, and threat intelligence data — creating richer reports without manual data entry. Request a demo to see the Mappings Manager in action.
Dradis supports the Nessus XML v2 format (NessusClientData_v2), which has been the default export format since Nessus 5.x. Any scan exported from Nessus 6.x, 7.x, 8.x, 10.x, or Nessus Expert/Professional will work. The legacy Nessus v1 XML format (.nessus files from Nessus 3.x and earlier) is not supported.
Yes. Each import adds new Nodes, Issues, and Evidence to the existing project. If you import a second .nessus file that contains the same host, the existing Node will be reused and new Evidence will be added under it. Issues are deduplicated by pluginID — if the same plugin already exists as an Issue from a previous import, the plugin creates new Evidence linking to the existing Issue rather than creating a duplicate.
Dradis will create duplicate Evidence entries for the same host/plugin combinations. The Issues themselves won't be duplicated (they're matched by pluginID), but you'll get a second set of Evidence entries. If you need to re-import cleanly, delete the existing Nodes and their Evidence first, or start a new project.
Nessus uses numeric severity levels 0-4 (Info, Low, Medium, High, Critical). These are available through the report_item.severity and evidence.severity fields, as well as the text-based report_item.risk_factor. The default template doesn't include severity as a standalone field, but you can add it via the Mappings Manager in Dradis Pro, or manually tag issues after import.
Yes. If your .nessus file contains compliance data (from audit files), the plugin imports the cm:compliance-* namespace fields into Evidence. You can access check names, pass/fail results, expected values, actual values, and remediation guidance through the compliance.* field family. This is particularly useful for PCI DSS, CIS Benchmark, and DISA STIG audits where you need to report on both vulnerabilities and compliance posture.
Loading form...
Your email is kept private. We don't do the spam thing.