Category Archives: Uncategorized

Turn Your Pentests Into Insights: The New Business Intelligence Dashboard

Remember when we shared a “Year in Review” script that could pull basic stats from your Dradis instance? Well, we heard your feedback loud and clear. You wanted more than a command-line script. You wanted insights that were easy to access, customizable to your needs, and powerful enough to help you make real business decisions.

Today, I’m excited to walk you through what we’ve built: a full-fledged Business Intelligence Dashboard that turns your Dradis data into actionable intelligence.
The Journey from Script to Dashboard

That original Year in Review script was simple but effective. It could tell you how many projects you created, count your Issues by severity, and show you the most commonly found vulnerabilities. But it had limitations. You had to SSH into your instance, run commands, and parse text output. And while it gave you a snapshot of your year, it couldn’t help you understand the why behind the numbers.

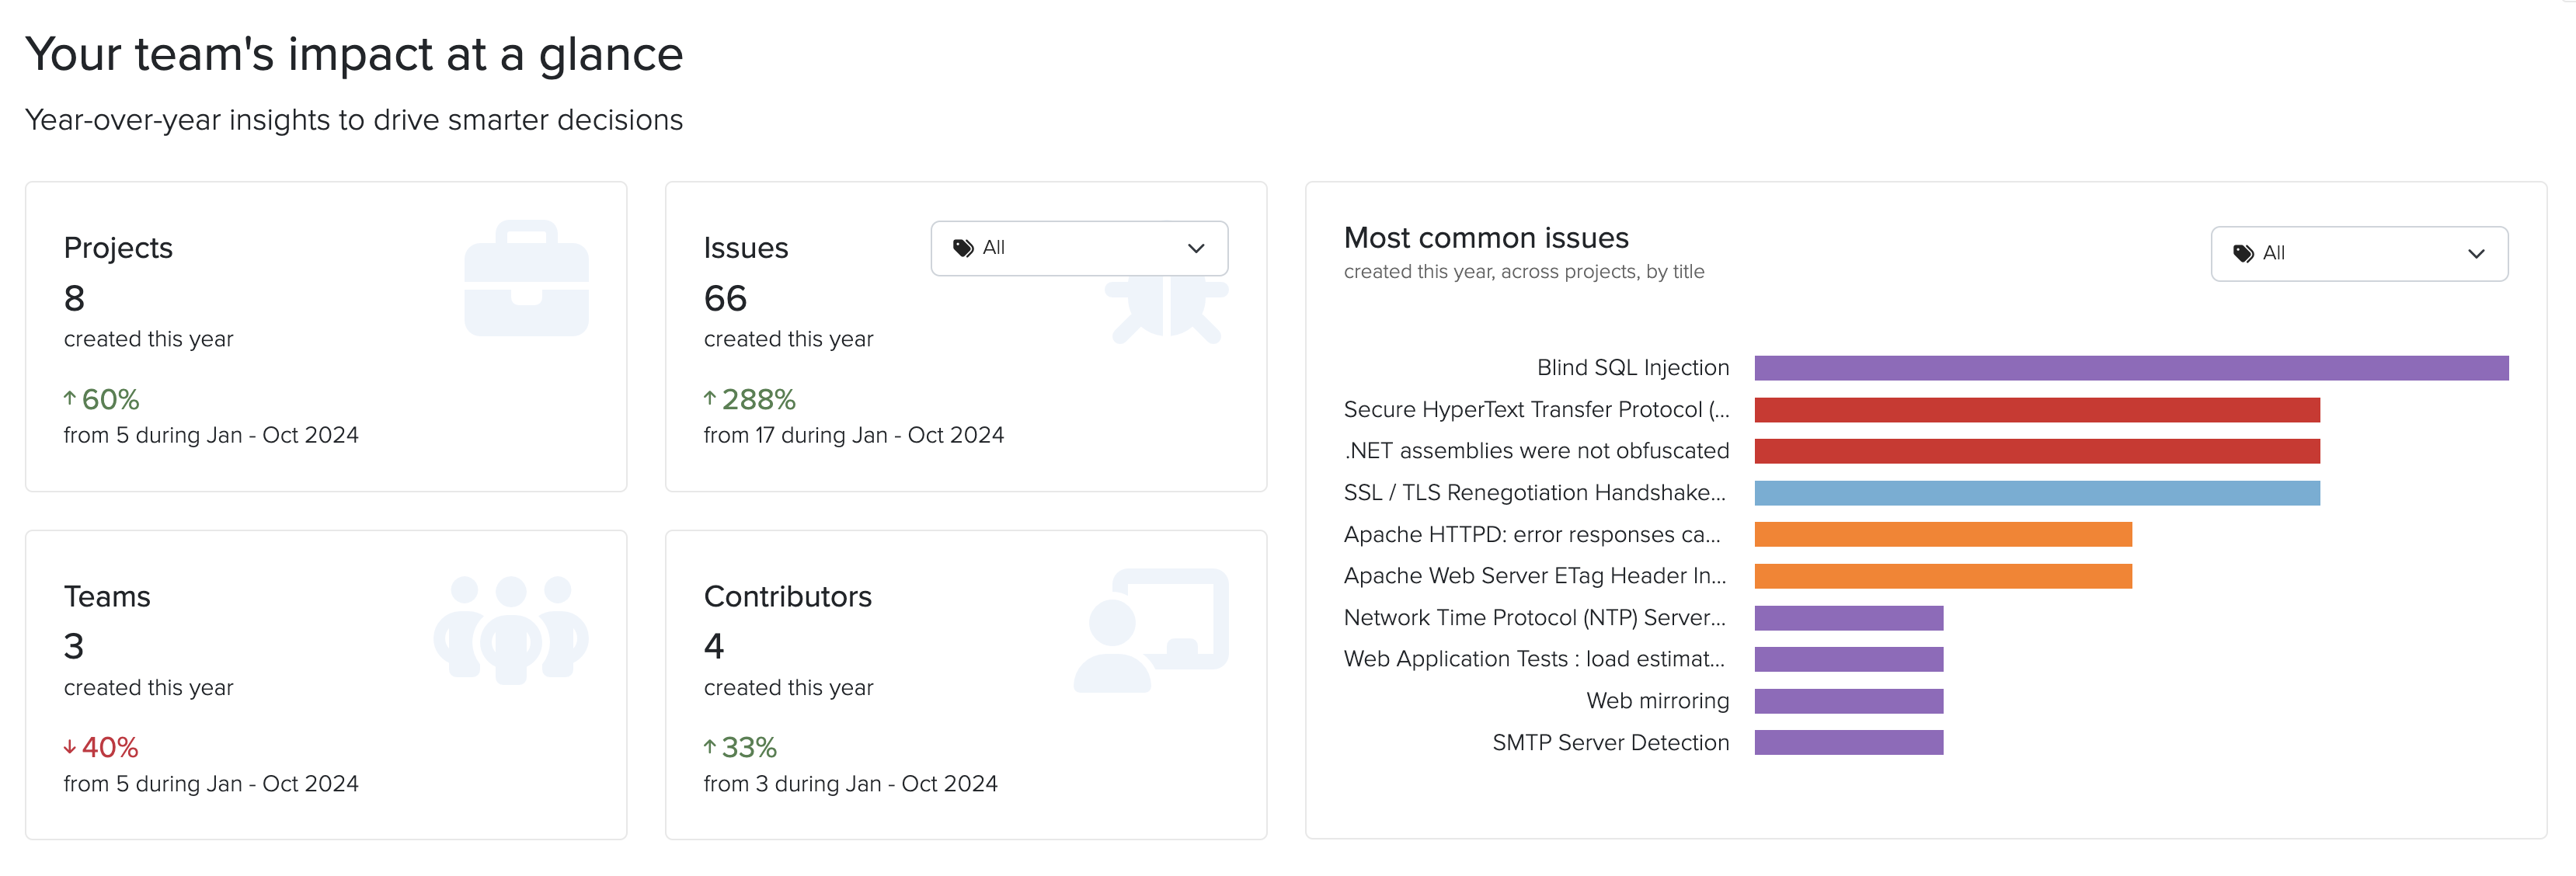
The Business Intelligence Dashboard takes that concept and expands it into something much more powerful. Instead of running scripts, you can now log into Dradis and immediately see:

  • Activity summaries comparing this year to last year for Projects, Issues, Teams, and Contributors
  • The most common Issues found across all your projects by Title, filtered by Tag
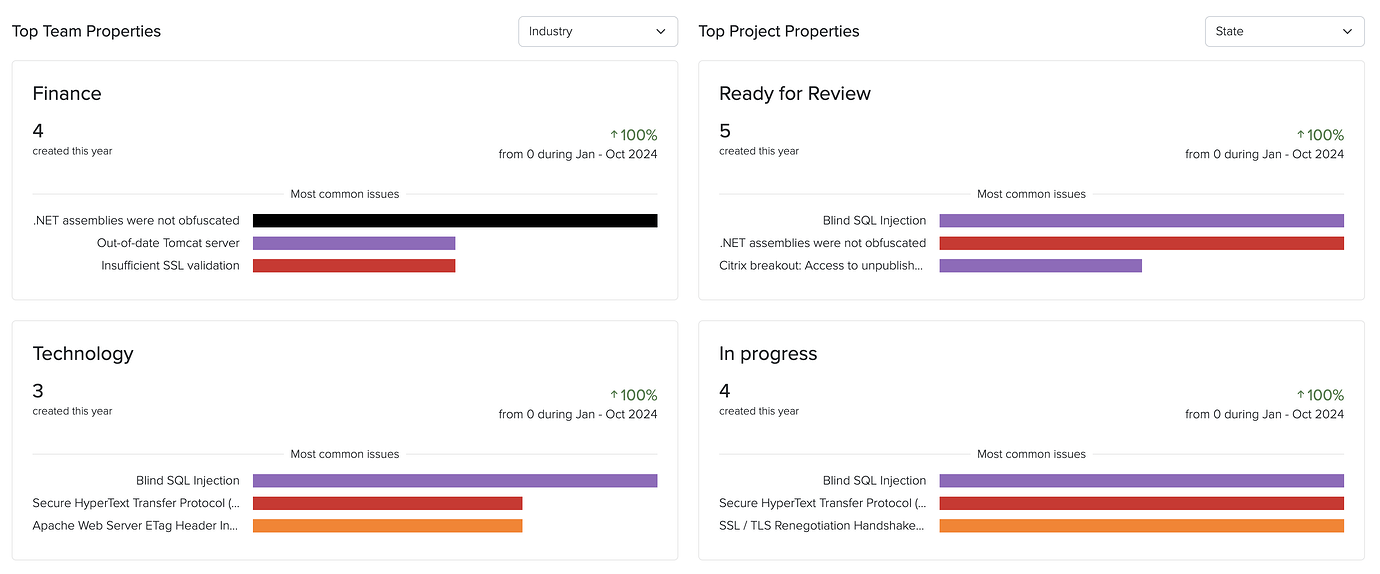
  • Custom metrics and trends based on your team and project properties

Custom Properties: The Foundation for Better Insights

The real power of the Business Intelligence Dashboard comes from custom properties. These let you tag and categorize your work in ways that matter to your business.
Team Properties

Want to know which industries you serve most? Or which types of clients are most profitable? Team properties let you define custom fields for your clients. You can create:

  • Integer fields for numerical data (revenue, number of employees, etc.)
  • String fields for text data (client contact information, notes)
  • List fields for categorical data (industry, region, client tier)

For example, you might create an “Industry” property with options like Healthcare, Finance, Retail, and Technology. Once defined, every time you create a new team, you’ll be able to select from these options.

Project Properties

Project properties work the same way, but let you categorize individual engagements. This is where you can track things like:

  • Project type (webapp, infrastructure, mobile, cloud)
  • Whether a project was under-scoped or over-scoped
  • Complexity level
  • Testing methodology used

These properties become the basis for answering critical business questions.

Existing Business Intelligence Features

Dradis has other Business Intelligence features beyond those we highlighted above. Once you’ve been collecting data through custom properties, the Dashboard transforms that information into visual insights and searchable metrics.

Automated Overview Charts

Every List property you define automatically generates a visual overview chart. These charts give you an at-a-glance understanding of your business composition. See instantly what percentage of your projects are webapp versus infrastructure, or which industries make up the majority of your client base.

Data Analysis Queries

The Data Analysis sidebar lets you drill down into specific questions. Want to see all teams in the Healthcare industry? Or find every webapp project from the last quarter? Just select the property you want to search, enter your criteria, and get instant results.

The results come back in a customizable table where you can toggle columns on and off to focus on exactly what matters. Each result shows not just the projects or teams that match your criteria, but also their associated Issues and other relevant data.

Trend Analysis: Compare and Learn

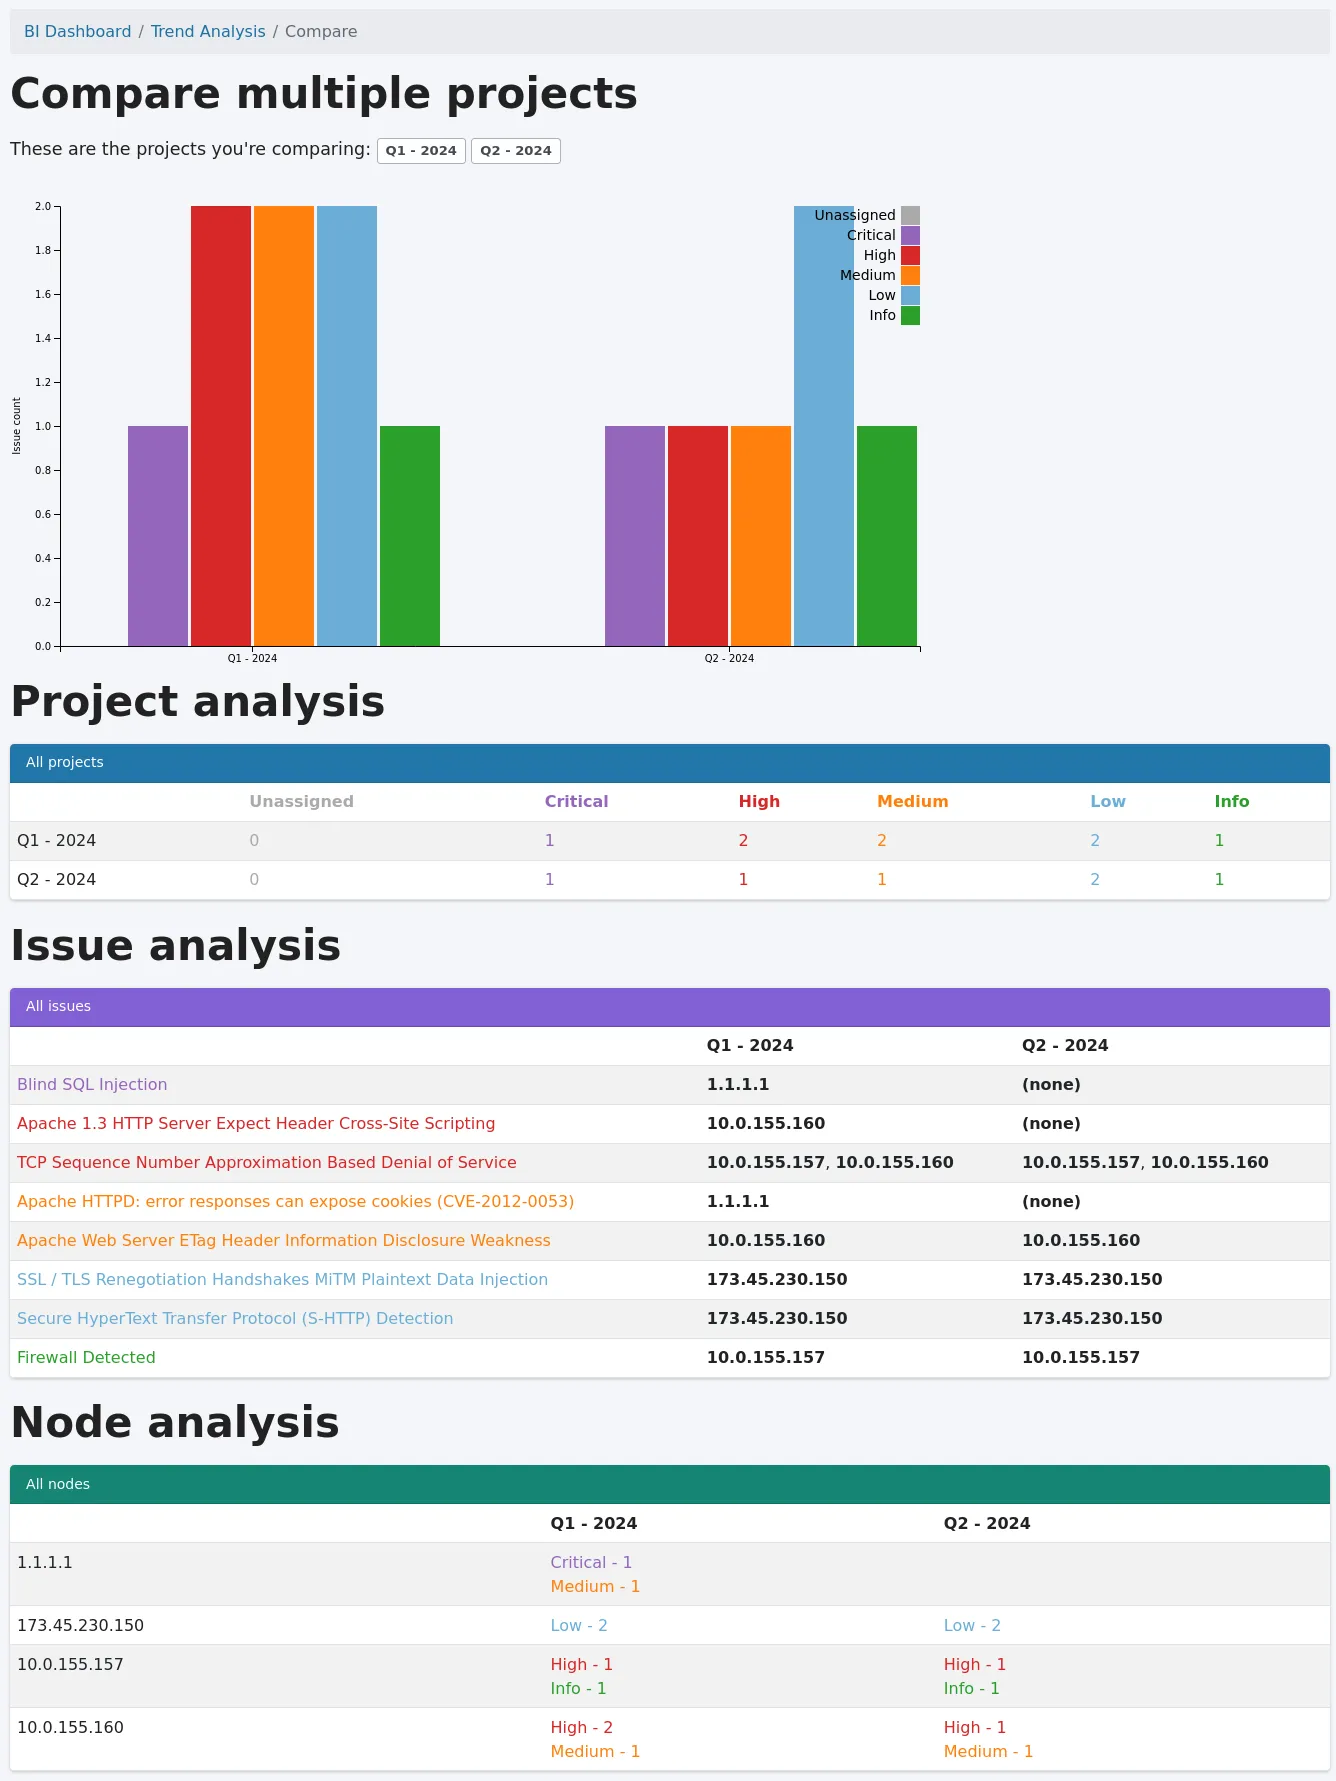
The Business Intelligence’s Trend Analysis feature lets you select multiple projects and compare them side-by-side to identify patterns and differences.

To use it:

  1. Click “+ Trend analysis” in the sidebar
  2. Select the projects you want to compare (use the filter to narrow your options)
  3. Click “Compare!”

The comparison shows you:

  • A graph of Issues based on tags across all selected projects
  • A project analysis table with Issue counts by tag
  • Issue analysis showing which Issues affect which Nodes in each project
  • Node analysis displaying Issue counts by tag for each Node

This is invaluable for understanding how similar projects differ, identifying trends over time, or comparing repeat/retest projects.
Answering the Questions That Matter

With the Business Intelligence Dashboard, you can now answer:

What types of projects are you running? Define a “Project Type” property and instantly see the breakdown in your overview charts.

What types of team industries are you serving? Create an “Industry” team property and use Data Analysis to explore the distribution.

Which types of teams are most profitable? Combine revenue properties with industry properties to identify patterns.

What percentage of your projects are under-scoped or over-scoped? Add a “Scope Accuracy” project property and let the Dashboard show you the numbers.

But it doesn’t stop there. The flexibility of custom properties means you can answer questions specific to your business that we never could have anticipated. That’s the beauty of this approach—you’re not limited to our assumptions about what matters. You define what success looks like, and the Dashboard helps you measure it.

What This Means for Your Team

The Business Intelligence Dashboard isn’t just about pretty charts. It’s about making better decisions:

  • Resource allocation: Understand which project types require more time and adjust your scoping accordingly.
  • Client focus: Identify which industries or client types align best with your expertise and business goals.
  • Quality improvement: Track Issue trends across projects to understand where your team excels and where there’s room for improvement.
  • Business growth: Use data to make informed decisions about which services to expand, which clients to pursue, and how to position your team in the market.

Getting Started

The new and improved Business Intelligence Dashboard is available now in Dradis Pro v4.19.0 and later. If you’re already using Dradis, navigate Tools > Business Intelligence to start defining your custom properties. If you’re new to Dradis, check out our complete documentation to learn more.

We’ve come a long way from that simple Year in Review script. But the journey isn’t over. We’re continuing to enhance the Business Intelligence Dashboard based on your feedback. What insights matter most to your team? What questions are you trying to answer? We’d love to hear from you.


Want to learn more about the Business Intelligence Dashboard? Check out our support guide for step-by-step instructions.

Redesigning Dradis: A Fresh Look for a Better Navigation and Consistency

Dradis has been a trusted tool in the pentesting world for over 15 years. Many changes, features, and components have been added during that period, all with a single goal: 

Offer the best possible product to our users.

However, as the platform evolved, the growing number of links and navigation layers made the layout feel more complex than we’d like. That’s why we’ve decided it’s time for a refresh.

Enter Hera

Pronounced /ˈhɪərə/, Hera Agathon is a character in the Battlestar Galactica universe. She was the first human-Cylon hybrid to exist, also known as “Shape of things to come” before her birth. Hera symbolizes a new era, the future, a way of moving forward, making it the perfect name for Dradis’ new updated layout!

Our main goal with this: make Dradis easier to navigate, give it a fresh look, and ensure a unified layout that feels consistent and intuitive.

The New Navigation Architecture

Navigation should be effortless and intuitive. You shouldn’t have to dig through menus or search for the pages you need. Everything important should be visible and easily accessible. That’s why the navigation system was the first thing we looked into. The new architecture brings cohesion and structure, making it easier to focus on your tasks. That said, Dradis is a sophisticated, and powerful platform, and as Tesler’s Law reminds us:

“For any system there is a certain amount of complexity that cannot be reduced.”

So as it was impossible to narrow down everything into a single navigation bar, we split the main navigation system into two horizontal menus, and two fully collapsible sidebars; because we know you need the space!

  • Main navigation: everything you need to stay on top of your tasks. From projects, to tools, to settings, can be found in the main navigation bar. Can be accessed from all pages.
  • Secondary navigation: everything you need that is section-related. Whether you’re working on a project, or using a tool, you can find all the related links here. Available as needed!
  • Left sidebar: dedicated to Nodes, allowing you to easily navigate through them.
  • Right sidebar: secondary sidebar for all your, well, secondary content. Everything that you could additionally need, but not necessarily.
Main and Secondary navigation (project)
Main and Secondary navigation (Gateway)
Sidebars open
Sidebars closed

A Fresh, Modern Look

Goodbye Grey, Hello White

We’ve also given Dradis a visual refresh to match its improved functionality. The new design is clean, modern, and easy on the eyes. Dradis now has a single unified layout that allows you to effortlessly navigate through all its sections, without feeling like you’re using two different applications.

Dradis Pro: Project overview
Dradis Pro: Projects
Dradis CE: Upload
Dradis CE: Issue

What’s Next?

While the navigation and visual updates are exciting, we’re not stopping there!

We’re also focusing on streamlining the editing experience to reduce friction and make content editing faster and easier. We’re looking into your feedback to design workflows tailored to specific tasks, so you can complete your work more efficiently. And – we’re doing all that while focusing on continuously improving usability.

Dradis is continuously evolving to meet your needs, with a focus on functionality, consistency, and usability.

Whether you’re a pentester, a manager, or anyone using Dradis for that matter, these updates are designed to help you do your job faster and with less frustration.

We can’t wait for you to experience the new Dradis. Let us know what you think!

Top 10 tables – a custom Dradis script

Imagine, you scan a few hundred hosts to create a summary report. You want to show data on ports and operating systems without giving the end user hundreds of pages of data. Enter the “Top 10” script!

Credit for this script idea goes to Chris from I.S. Partners. He reached out via the support inbox to see if we could create a “Top 10” script that would do the following:

  1. Create an array of all of the operating systems, ports/protocols, and services in the project
  2. Deduplicate the arrays and count the number of instances
  3. Narrow down the array to the top 10 based on the number of instances
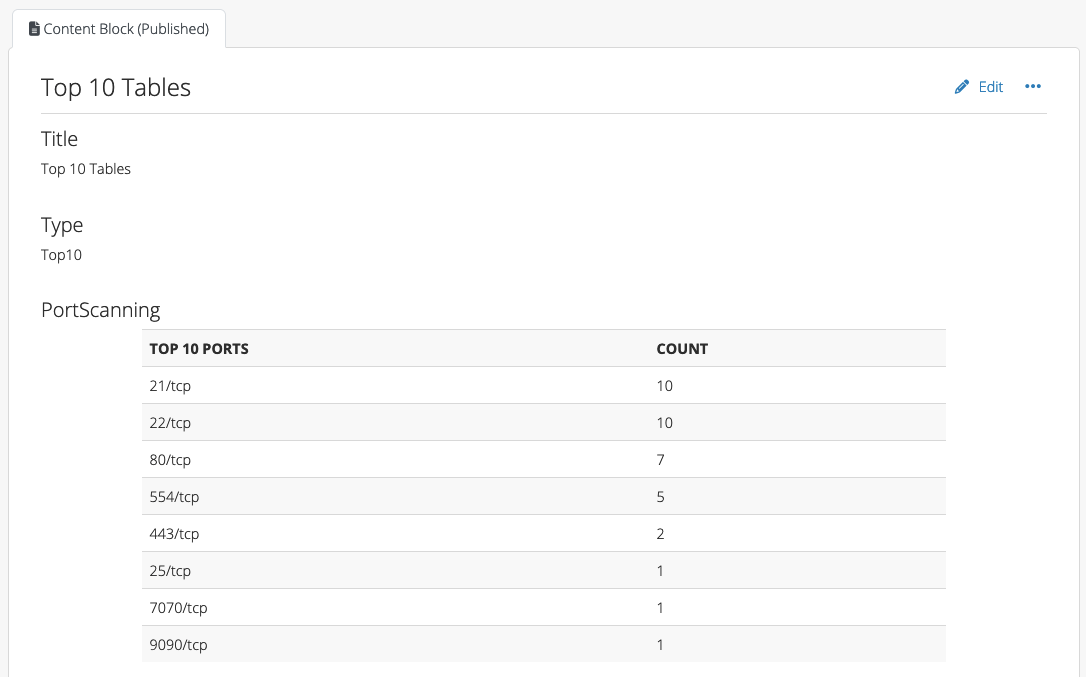
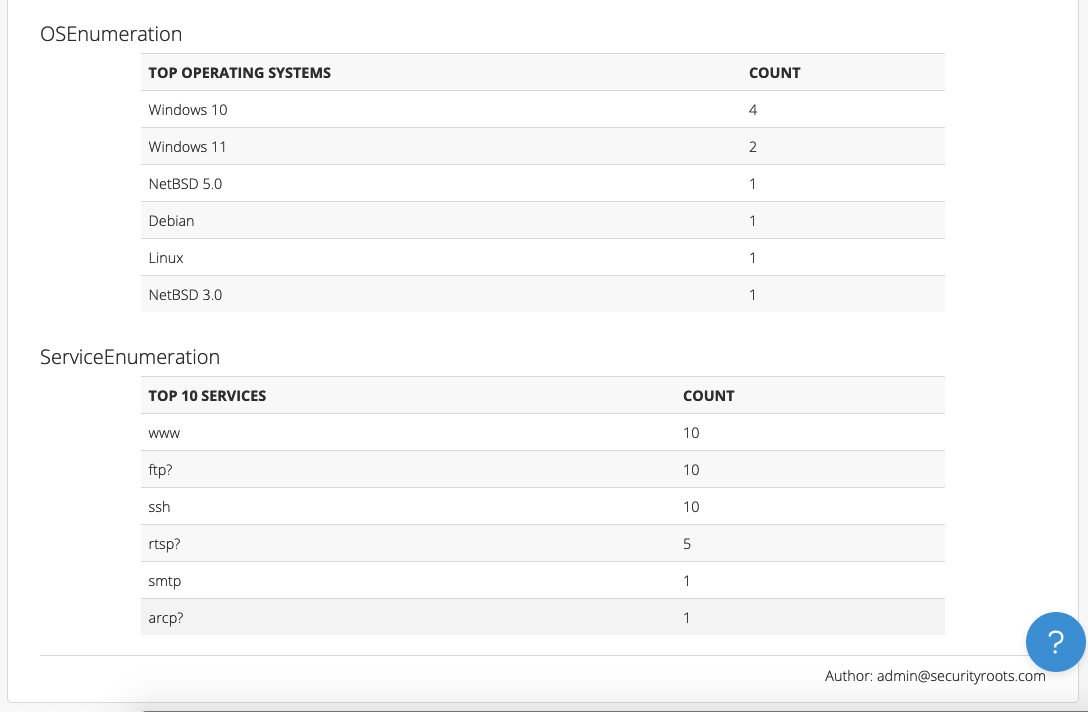
  4. Update a Content Block in the project with a textile table based on each array

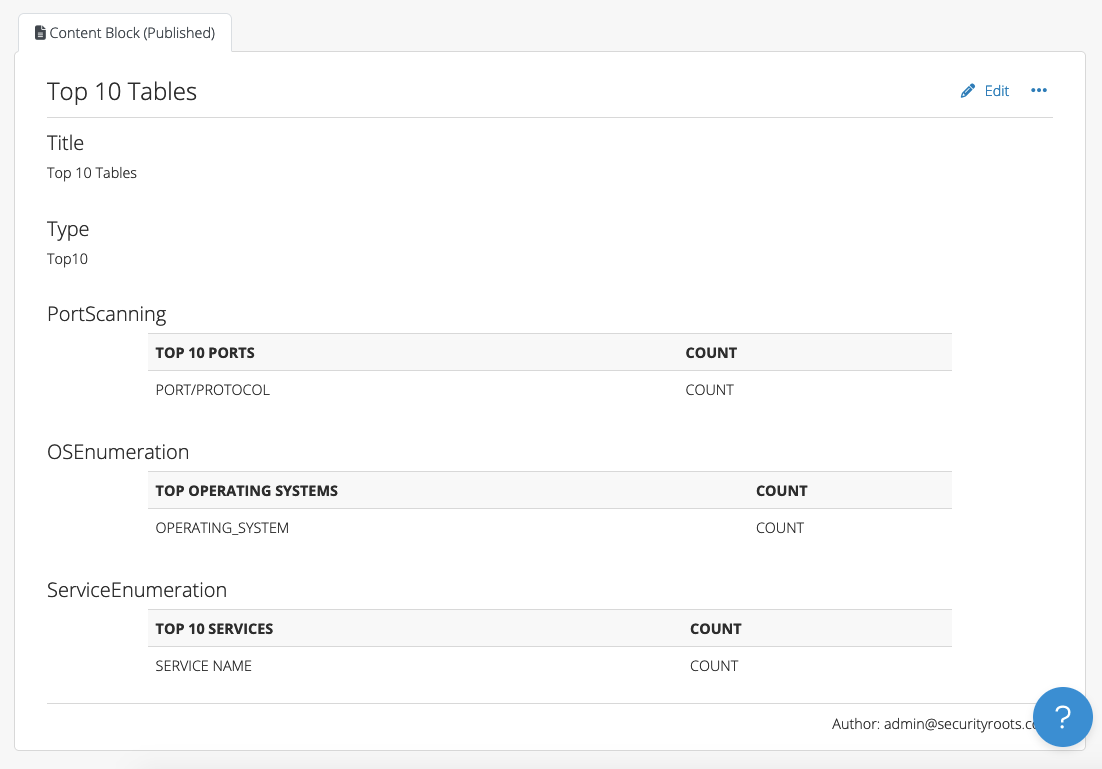
The script assumes that you have a Content Block with the Type field set to “Top10” with the following fields:

  • PortScanning
  • OSEnumeration
  • ServiceEnumeration

Head to our scripting repo and check out the “Top 10” script. To use it:

1. SCP the top10.rb file to your instance (e.g. to the /tmp folder)

2. In the browser, find the project ID of the project that you need to update. For example, if your project lives at /pro/projects/123 in the browser, the ID is 123.

3. Run the following in the command line as “dradispro”:
$ cd /opt/dradispro/dradispro/current/
$ RAILS_ENV=production bin/rails runner /tmp/top10.rb <project_id>

You’ll need to sub in your project ID (Step #2 above) for “<project_id>” above! Example:

$ RAILS_ENV=production bin/rails runner /tmp/top10.rb 123

When the script completes, you’ll see this output in the console:

Port Scanning table updated!
Service Enumeration table updated!
OS Enumeration table updated!

After running the script, you can refresh the Top 10 content block to see the updated tables:

Chris reported that with their largest Nessus file (125MB), the script was able to perform the calculations successfully in less than 30 seconds. We’re optimistic about a similar script’s performance with your projects.

This script will need to be adjusted to meet your individual team’s specific requirements and preferences. But, we think it’s a promising option for teams who prefer not to use VBA or want to create similar tables in their Word reports.

If you need any help customizing this script to meet your specific use case, please reach out to our support team. Or, if you have ideas for improvements, please fork the repo and post in our users forum.

Year in Review – a future Dradis feature

This feature was implemented in Dradis v4.19.0.
Check out the full details in our forum post.

How many Dradis projects did you create this year? How many Issues did you find? What were the most commonly found Issues? What was the most common severity of the Issues that you found?

Credit for this script idea goes to Marc Ligthart. His teammate reached out via the support inbox to see if we could create a quick “Year in Review” script that would list out the following:

1. Count of Projects created this year
2. Total Critical/High/Medium/Low Issues (by Tag)
3. Top 10 most found Issues (by title)
4. Top 10 most found Critical/High/Medium Issues (by title)

Dradis year in review script output example
Example output from the year-in-review script

You can already head over to our scripting repo and check out the Year in Review script. To use it:

1. SCP the file to your instance (e.g., to the /tmp folder)

2. Run the following in the command line as “dradispro”:
$ cd /opt/dradispro/dradispro/current/
$ RAILS_ENV=production bundle exec rails runner /tmp/year_in_review.rb

The output will list out the yearly review for all of the projects present on your Dradis instance.

Now, for the fun part? We want your feedback. If you like this idea, you’ll like version 2.0 even better. We want to include this functionality as part of the existing Business Intelligence Dashboard within Dradis. But first, we want to hear from you. What else would you like to see in a summary view like this in the BI Dashboard? What other metrics would be helpful for your team, or what isn’t particularly useful about the current output? Please email our support team directly with feedback! We’re excited to continue working with you in 2020 and get you some more valuable insights into your Dradis usage along the way.

Windows cannot find ‘blunder’ error on Dradis 2.7.1

Update May/26: An updated installer has been published that fixes the issue described below and is available through the download page.

The Dradis 2.7.1 Windows package (dradis-v2.7.1-setup.exe) that we released yesterday contains a typo in in one of the batch files: server.bat.

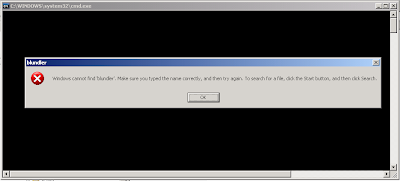
If you try to run the file directly or through the Start menu start server icon, you will get an error message:

Windows cannot find ‘blundler’. Make sure you typed the name correctly, and then try again. To search for a file, click the Start button, and then click Search.

In order to fix this open the file in an editor (go to the Start menu icon, right click > Edit) and adjust it to:


@echo off

::If the script doesn't work, uncomment and adjust the following:
set PATH=c:\Ruby187\bin;%PATH%
set RAILS_ENV=production
set BASE=%~dp0
cd %BASE%\server\

start "Dradis Framework Server (Ctrl+C to terminate)" bundle exec rails server webrick

Thanks to Doug Ipperciel for bringing this to our attention.

5 comments:

  1. Unknown said,its not working on my windows 8 version
    ON 16 DECEMBER 2012 AT 15:38
  2. Unknown said,my message says

    bundle
    windows cannot find ‘bundle’.Make sure you typed the name correctly and then try againON 16 DECEMBER 2012 AT 15:41
  3. Unknown said,hey got it to work thanks my bad i install it on xp very simple then 7 then 8 pretty goodON 16 DECEMBER 2012 AT 17:20
  4. Anonymous said,not working on v 2.9 yetON 26 SEPTEMBER 2015 AT 04:36
  5. Unknown said,It works. Thank you for sharing. If you have problems with dll files, look there http://fix4dll.com/mfc110u_dll. I had a problem with it, do not run the program’s. After fixes dll files, everything worked. Good luck.ON 2 JUNE 2016 AT 15:40

Dradis 2.7.1 released!

This bug-fixing release features:

  • Several closed issues: #3, #4, #6, #7, #8 and #10.
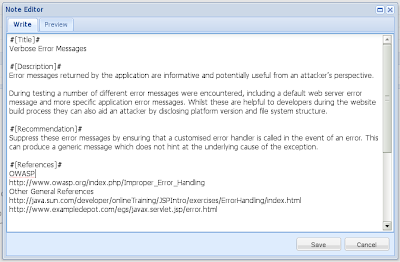
  • A cleaner, leaner note editor:

And all the goodness introduced in 2.7.0:

  • Improved command line API with Thor (thor -T to view all commands)
  • New Configuration Manager to handle all plugin config settings
  • New Upload Manager that runs uploads in the background and updates the interface through Ajax
  • New plugins:
  • Updated plugins:
    • Nessus plugin supports .nessus v2
    • Vuln::DB import updated to support the latest release
  • Bugs fixed: #2888332, #2973256
  • Update Rails to 3.0.6

download now

Upgrading from Dradis 2.7.0 to 2.7.1

This week we are releasing Dradis Framework 2.7.1 which closes several bugs and brings a new note editor.

If you’re new to Dradis or upgrading from an older (2.6.x, 2.5.x…) release, go ahead and download the full package from the downloads page.

However, if you already have a working install of Dradis 2.7.0 maybe you don’t want to run the Windows installer again, or wait until your distro prepares an updated version of the package (did you know that BackTrack 5 shipped with Dradis 2.7.0?). Here is how to get the latest 2.7.1 code up and running.

Go to your install location:

In Windows:

c:\> cd %APPDATA%\dradis-2.7


In BackTrack:

# cd /pentest/misc/dradis


Backup the old server folder:

# mv server 2.7.0-server


Now you have a decision to make: upgrade to 2.7.1 or clone the Dradis repository so you can upgrade to 2.7.1 but also to any forthcoming releases (recommended)

Upgrading to 2.7.1

Download and uncompress the tarball for Dradis server 2.7.1 from GitHub:

https://github.com/dradis/dradisframework/tarball/REL-2.7.1

Uncompress in the drads-2.7 folder renaming the extracted directory to just server.

Using git repository for easy upgrading

From the current folder, clone Dradis git repository and point it to the latest release:


# git clone https://github.com/dradis/dradisframework.git server
# cd server
# git checkout -b REL-2.7.1 REL-2.7.1
# cd ..

Reset the environment and run the server


# ./reset.sh
# ./start.sh

If everything goes according to plan, you can now access Dradis on https://localhost:3004/ and in the top-right corner the version number will be 2.7.1.

Running Dradis Framework (2.7) in BackTrack4 R2

Following the series of articles on how to get the Dradis Framework running in different operating system, this time is the turn of BackTrack 4 R2.

Note this is almost a re-post of my Running Dradis Framework in BackTrack 4 R2 but updated to 2.7 (instead of 2.6.1).


First, get a download link for the latest Dradis from http://dradisframework.org/downloads.html and get it:

# wget http://downloads.sourceforge.net/dradis/dradis-v2.7.0.tar.bz2

Extract it:

# tar -xvvjf dradis-v2.7.0.tar.bz2


Next we need to update the version of RubyGems installed in BT4:

# gem -v
1.3.1
# gem update --system
[...]
# gem -v
1.7.2


And install the Bundler gem:

# gem install bundler


There is only one missing prerequisite to ensure everything runs smoothly, the development bindings of the libxslt package. You can get them with:


# apt-get install libxslt-dev


Now we are ready to get things going:

# cd dradis-2.7

# ./reset.sh
Your Gemfile's dependencies could not be satisfied
Install missing gems with `bundle install`
Some Ruby gems are missing, do you want to install them now? [y] y

Ok then, I am going to run bundle install for you, then you should run this script again.

Fetching source index for http://rubygems.org/
Installing rake (0.8.7)
Installing RedCloth (4.2.5) with native extensions
Installing abstract (1.0.0)
[...]
Your bundle is complete! Use `bundle show [gemname]` to see where a bundled gem is installed.


After all the dependencies are installed, we are ready to initialize the database and start the server. However, there is just one thing that have to be changed in the startup scripts.

Edit the last line of reset.sh to look like this:

bundle exec thor dradis:reset

Now we are ready, run the reset script again to generate the database:

# ./reset.sh

And start the server with:

# ./start.sh

Everything should be up and running in: https://127.0.0.1:3004/